Slow Charging the i-MiEV, CZero and iOn
Every time our cars are slow charged from SoC less than SoC 24% to 100% the battery capacity is measure by the BMU. Here is a detailed description of the process based on a slow charge I recorded a month ago.
Slow Charge May 2023
To start with here are some
definitions.
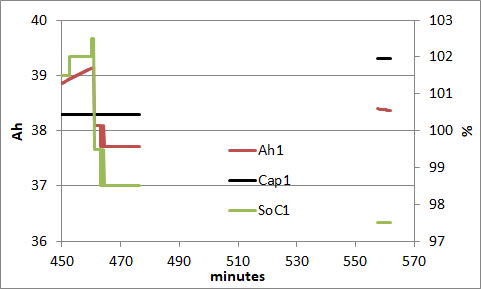
Cap1 is the capacity reported by CaniOn and EVBatMon. OBDZero reports it as the Battery Management Unit (BMU) capacity. Ah1 is the present charge in Ah in the battery corresponding to Cap1. OBDZero and EVBatMon reports this but not CaniOn. SoC1 is the State of Charge equal to 100 * Ah1/Cap1. SoC1 is reported by EVBatMon as SoC. It is reported by OBDZero as SoC1. CaniOn does not report it. Range is computed using Cap1, Ah1 and SoC1.
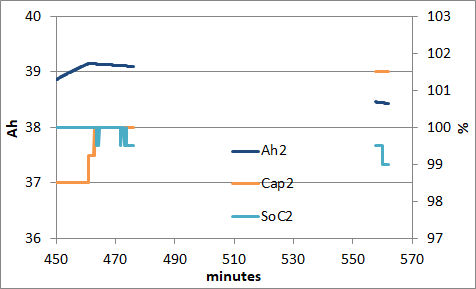
Cap2 is a second capacity computed by the BMU. It isn’t reported by CaniOn or EVBatMon. It is reported by OBDZero as just the battery capacity. SoC2 is the SoC reported by CaniOn but not EVBatMon. It is reported in OBDZero as SoC2. Ah2 is the present charge in the battery corresponding to Cap2. It can be computed by
Ah2 = SoC2 *Cap2/100. I have not found a PID containing Ah2 but I’m fairly sure that the BMU keeps an account of Ah2. In this case I have computed Ah2 based on the measured amps to the battery. This is called Coulomb counting.
Now the
slow charge data
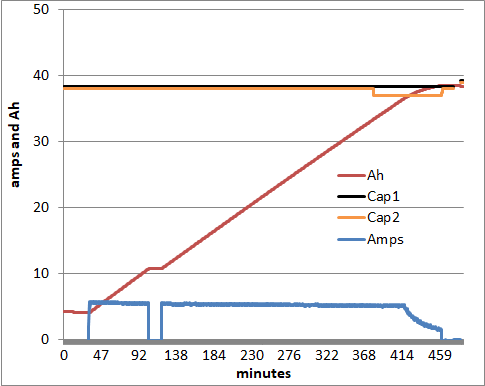
During the slow charge show in the graph above and before SoC1 reached 28 %, Ah1 and Ah2 increased by Coulomb counting by the BMU. The BMU computes SoC1 and SoC2 according to:
SoC1 = 100 * Ah1 / Cap1
SoC2 = 100 * Ah2 / Cap2
Cap1 was 38.3 Ah and Cap2 was 38 Ah.
On this day the charging pause that we often see at about SoC 30% began when SoC1 was 28%. Looking at other slow charges the pause can begin between 24% and 37%. It appears that the trigger is not the SoC but a battery voltage of about 339 V while charging.
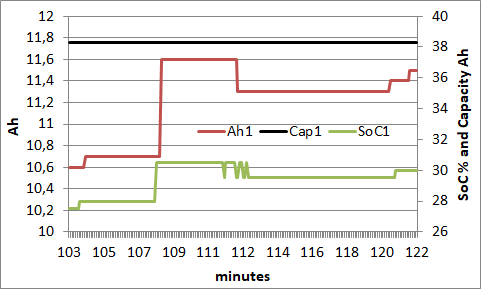
During the pause shown here between 105 minutes and 120 minutes, charging stopped and the amps went from about 5 down to about -0.5. While the current was low, the BMU measured the open circuit voltage (Voc) and computed the true SoC of the battery. SoC1 is adjusted to the true SoC using a simple function such as:
SoC1 = a* Voc + b
The factors a and b are specific to the LEV50(N) cell but I don’t know what they are yet.
Cap1 didn’t change and Ah1 was updated according to:
Ah1 = SoC1 * Cap1/100
In this case SoC1 was 29.5 % when the pause ended and
Ah1 = 29.5 * 38.3 / 100 = 11.3 Ah
Studying other slow charges, SoC1 varied between 29 % and 32 % at the end of the pause.
Ah2 decreased by Coulomb counting but changed only slightly because the current from the battery was very small. Cap2 didn’t change and
SoC2 = 100 * Ah2 / Cap2
Other things like cell balancing may occur during the pause but I believe the primary purpose of the pause is to measure Voc and compute the true SoC of the battery.
After 15 minutes charging resumed and both Ah1 and Ah2 increased by Coulomb counting as before the pause. The BMU also computed the SoCs as before:
SoC1 = 100 * Ah1 / Cap1
SoC2 = 100 * Ah2 / Cap2
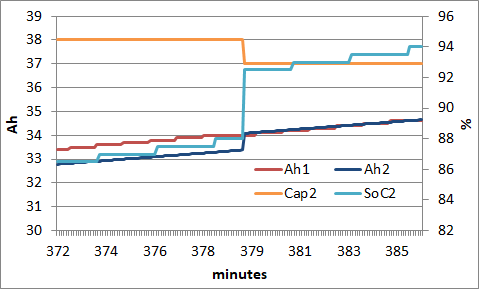
At 379 minutes shown in the graph above SoC1 was 89%. Both Ah2 and Cap2 were updated. Cap2
decreased from 38 Ah to 37 Ah and Ah2 was set equal to Ah2
Then SoC2 was updated according to the new values for Ah2 and Cap2.
SoC2 = 100 *Ah2 / Cap2
In this case SoC2, the light blue line, increased from 88 to 92.5%
At the same time, there were no changes in Cap1, SoC1 or Ah1.
This update always occurs when SoC1 is 89% during a slow charge. However, the changes in SoC2 and Cap2 are often too small to see.
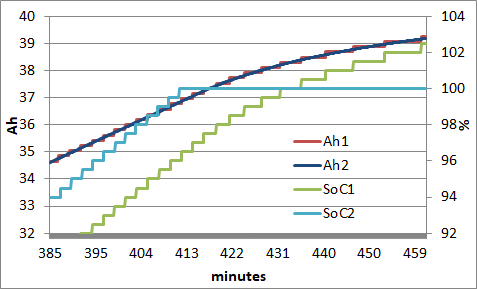
After that, Ah1 and Ah2 were equal and both increased by Coulomb counting. SoC1 and SoC2 were computed by the BMU according to:
SoC1 = 100 * Ah1 / Cap1
SoC2 = 100 * Ah2 / Cap2
When SoC2 reached 100% at 461 minutes, it stopped increasing but Ah2 continued to increase due to Coulomb counting. Ah1 also increased by Coulomb counting and Ah1 and Ah2 were still equal. SoC1 also continued to increase beyond 100% according to
SoC1 = 100 * Ah1/Cap1.
When balancing of the cells finished at 461 minutes, charging stopped. However the capacity measurement wasn’t complete. All PIDs continued to flow on the CAN network for another 15 minutes. Ah2 decreased due to Coulomb counting but only slightly because the current from the battery was very small. During this time the BMU was busy completing the measurement. Among other things, Cap2 increased slowly from 37 to 39 Ah in order to match Ah2. I don’t know why Cap2 didn’t change immediately to Ah2 but instead increased slowly over 15 minutes. The change in Cap2 occurred before data stopped but my app didn’t record this change until 558 minutes, when I turned the car on and full data transmission resumed. By this time Ah2 and SoC2 had also been updated and
SoC2 = 100 * Ah2 / Cap2
During the period from 476 minutes and 558 minutes there were only 4 PIDs transmitted on the network at 1 minute intervals. These didn’t contain data related to the charging process. The reason for the 82 minute gap was that full data transmission stopped at 6 o’clock in the morning. It took me 82 minutes to wake up, drink a cup of tea and then go out to the car and turn it on. When I turned on the car, all PIDs became available on the CAN network again.
This graph shows Ah1, SoC1 and Cap1 over the same period as the previous graph. During the 15 min after charging at 461 minutes and until data transmission stopped at 476 minutes the current was about -0.5 amps, the BMU measured the Voc and computed SoC1 according to:
SoC1 = c*Voc + d
Like a and b above c and d are specific to the LEV50(N) cell and I don’t know what they are yet.
Cap1 doesn’t change and Ah1 is computed from SoC1 and Cap1.
Ah1 = SoC1 *Cap1 /100
When full data transmission restarted at 558 minutes, both Cap1 and Ah1 had been updated. Cap1 increased from 38.3 Ah to 39.3 Ah, a 1 Ah hop.
How the new capacity was computed
I believe the measured capacity was computed based on SoC1 and Ah2 at the end of the pause at 100% shown above and Ah1 and SoC1 at the end of the 30% pause shown in the second graph from the top. This next equation is the simplest way to compute the capacity:
Capacity = 100 * (Ah2_100 – Ah1_30) / ( SoC1_100 – SoC1_30)
Capacity = 100 * (39.1 – 11.3) / (99.5 - 29.5) = 39.7 Ah
The reason Ah2_100 was used rather than Ah1_100 is that Ah1_100 was updated with the measurement of Voc. On the other hand Ah2_100 wasn’t updated and Ah2 _100 minus Ah1_30 was the actual number of Ah added between the SoC 30% and 100%. At the same time SoC1_100 – SoC1_30 was the true change in the SoC between 30% and 100%. Dividing the true change in the Ah with the true change in the SoC and multiplying by 100 gives 39.7 Ah, the measured capacity. This is greater than 39.3 Ah, Cap1 after being updated. I believe the BMU limits increases in the capacity to 1 Ah. Therefore Cap1 only increased from 38.3 to 39.3. This limit prevents possible errors in the measurement from causing wild changes in the capacity.
After 476 minutes, the measurement was complete. From then on, Ah1 and Ah2 were equal and they decreased by Coulomb counting. SoC1 and SoC2 were computed according to:
SoC1 = 100 * Ah1 / Cap1
SoC2 = 100 * Ah2 / Cap2
I don’t know why this process is so complicated. If the only objective was to measure the capacity then it could be much simpler. One secondary objective could be to have a SoC, in this case SoC2, that doesn’t exceed 100%. This then would be the SoC displayed on the left hand side of the instrument panel.
David


