Battery Capacity Testing

Mitsubishi i-MiEV Forum

Help Support Mitsubishi i-MiEV Forum:

This site may earn a commission from merchant affiliate links, including eBay, Amazon, and others.
I have som interesting results that I want to share on the forum.

I have measured battery capacity at the dealer every year since I bought the iMiev i 2011:
Date: Km: CPU: Battery current capacity:
27. 3.2012 19929 1917 42,3 Ah
19. 4.2013 41183 4026 40,8 Ah
17. 1.2014 58661 5596 39,4 Ah
14.11.2014 No battery report, only that "Battery is OK"
5.10.2015 94818 9386 44,1 Ah
1.12.2015 98199 9763 39,3 Ah
1.12.2015 98227 9764 39,2 Ah
1.12.2015 98246 9768 45,8 Ah

It was just after the test in October this year when the battery suddenly was empty (turtle displayed and car stopped) with still one bar left.
It seems like the CPU was fooled into believing there were more capacity in the battery than there actually were.
I also measured battery voltage to be just over 3V (I think 3,050) one day with SoC around 10% if I remember right.

I complained and the dealer performed a new set of tests December 1st.
He found that the battery capacity increased by 15%! during the service and was quite happy!
This is clearly wrong, but what can I do when the dealer says "Battery is OK".

I also performed a battery test yesterday from SoC 56% to 22% with the lowest voltage dropping from 3,885 to 3,540 V.
I can send you the 10 datapoints if you are interested to plot my numbers in your diagram, BlueLightning?
 
bobakka said:
...I have measured battery capacity at the dealer every year since I bought the iMiev i 2011:
Date: Km: CPU: Battery current capacity:
27. 3.2012 19929 1917 42,3 Ah
19. 4.2013 41183 4026 40,8 Ah
17. 1.2014 58661 5596 39,4 Ah
14.11.2014 No battery report, only that "Battery is OK"
5.10.2015 94818 9386 44,1 Ah
1.12.2015 98199 9763 39,3 Ah
1.12.2015 98227 9764 39,2 Ah
1.12.2015 98246 9768 45,8 Ah
...
I complained and the dealer performed a new set of tests December 1st.
He found that the battery capacity increased by 15%! during the service and was quite happy!
This is clearly wrong, but what can I do when the dealer says "Battery is OK".

That is interesting data.

In the service manual for Main Battery On Vehicle there are 2 procedures related to capacity: measurement, and check

Did the dealer perform the automatic capacity measurement at each of these visits (which takes about 6 to 10 hours , or did he just read the BMU data item #23 to check the capacity?

What is the meaning of CPU--it seems to track odometer mileage somewhat.
 
Yes the reported AH capacity is still something we don't understand. How where and why it reports the numbers.

To know the true capacity of your car I feel the only 100% way is to test the weakest cell out of the car.

I could understand the capacity growing and shrinking a little from winter to summer (if test were performed at different times of the year) Though not to much.

Last time I checked my car the ECU's stored capacity reported 38.6AH. Though I have notice no range drop from when the car was brand new. Some say a new Imiev should report 48ah new though I don't believe this as most Imiev's tested with less than 5000km , first few months of ownership report low 40's.....like 20% less than the reported 48ah new car in just a few thousand km driving I don't think so.

So I give up I cant make any sense of this number.

The trouble is if the car thinks it has less capacity than the cells realy do then you get a false low usable range. (Turtle with cells still very strong and to much reserve capacity) If *** gets it wrong in the other direction then you get the turtle popping up with one bar on the dash or more catching you out.

kurt
 
Having never been able to get the Ah rating of either battery pack, I tried to do a Wh capacity calculation with SoC.

From 98 to 97% with a 9 kW driving load, consumption showed 130 Wh (making for 13,000 Wh total capacity), but the second calculation from 94% to 93% showed 162 Wh (making for 16,200 Wh, from 100% to 0%). I'm not sure if these are correct as I plugged the car in at work and the SoC jumped 6% higher in a couple of minutes, and this was on level 1.

My friend has a Focus Electric that he has modified, and has a nifty feature showing energy to empty. Unfortunately, I don't think the i-MiEV broadcasts that info on the CANBus unless it is requested by the MUT-3.
 
BlueLightning's chart is a very useful tool. My bad cell #47 is only reading 3.95 when all the rest are at 4.1, and the gauge only goes to 10-11 bars. The mut clone device and canion both report SOC at 60 to 66%. So there are several ways to view the issue.

i hope to get the dealer service to run the cell smoothing function using MUT on december 11, but they didn't seem too open to my suggestion. They want to drain the pack, then recharge, then drain again, then figure out what to do...
 
From my trips I understood that I have 14kwh available from 100% to 0% SOC in Canion. I made a trip from 100% to 9% and extrapolated the Wh out (minus Wh reg) to obtain this value. Furthermore, when the average consuption is 140 Wh/km, I see that I consume 1% SOC per each km, leading also to the 14kwh value. I believe this corresponds to the usable value in a new car with the 16kWh baterry (not sure about the 14.5kWh triplets).


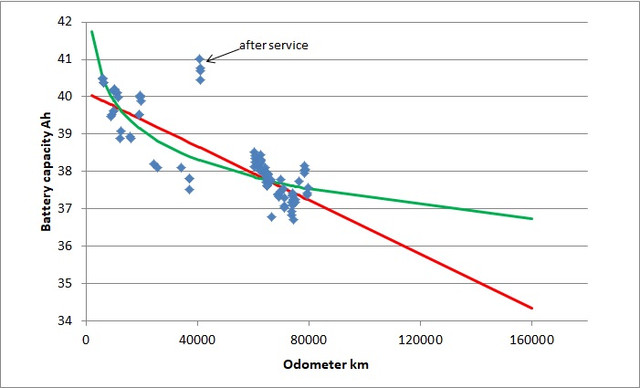
In an earlier post BlueLightning suggested measuring the fully charged battery capacity by comparing the change in kWh with the change in SoC while charging. I have done something similar using measurements of amps to the battery and the SoC collected from my CZero now and then over the last 4 years. This covers mileage from 6000 km to almost 80000 km. Up to 50,000km the data was collected with Canion at about 1 second intervals. After 50,000km the data was collected with OBDZero at about 4 second intervals. I first divided the data into measurement sets without gaps. This resulted in about 400 measurement sets most of which were quite short. I then used this formula to compute Ah for each timestep:
Ah = (A0 +A1)*dH/2
Where A0 is the amps measured in the previous timestep and A1 is the amps measurement in the present timestep. dH is the timestep (either 1 sec. or 4 sec.) in hours.
For each continuous measurement set I added up the Ah values and the changes in SoC. I then computed the battery capacity using this formula:
CapAh = 100*Sum(Ah)/Sum(dSoC)
Where Sum(Ah) is the accumulated amp-hours to the battery, dSoC is a 0.5% change in SoC and Sum(dSoC) is the total change in SoC in each continuous measurement set.
Most of the original measurement sets were too short to give meaningful results. By setting a minimum of 20% change in SoC for a useful set, 100 sets remained. The capacities computed from these sets are shown as points in the graph above.
The loss of capacity over time is easy to see but there are ups and down along the way. The most obvious of these are the capacity measurements between 40 and 41 Ah at a bit more than 40,000 km. As noted in the graph these measurements were record shortly after the car was serviced at 40,000 km. I believe that as part of the service the car’s battery capacity estimate was reset to 41 Ah or higher. This agrees with bobakka’s observation that the battery capacity seemed to be too large when their car was serviced. This also shows that in reality I’m computing the car’s estimate of the capacity not the true battery capacity. The less marked ups and downs in the capacity may be due to temperature changes and of course errors in the measurements.
The red and green lines in the graph are two models fitted to the data. The green line is:
CapAh = 50.4 - 1.14*ln(km)
And the red line is:
CapAh =40.11 - 0.000036*km
The green natural log line fits the data a bit better than the red linear model. However neither fit is good and I need more data in other to be certain of which model gives the best description of aging. There are other reasons to believe that a natural log model best describes battery aging so with a bit of luck I will have a useable battery for some years to come.
 
CZeroOwner said:
...There are other reasons to believe that a natural log model best describes battery aging so with a bit of luck I will have a useable battery for some years to come.
CZeroOwner, thank you for your graphs and analysis. Agree that the log line is perhaps a better approximation, which bodes well for our future.

For myself, I've given up closely monitoring the car and am content with taking occasional samples such as last weekend's 50-mile highway excursion to the San Francisco Auto Show where I plugged in and had RR=84 before the drive home. Good enough, although this replacement battery only has about 30,000 miles on it with CaniOn reading 38.3Ah.
 
datom's German data shows a much more drastic decline in capacity than I'm predicting. I seem to remember reading that a Li-ion battery can have a long period with constant capacity followed by a sudden decline. The German data supports this.


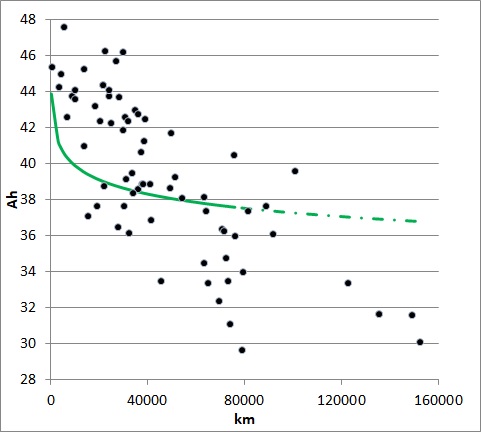
The black dots in the graph above are battery capacities for 44 German owned iMiev/CZero/iOns collected by datom. There is a link in his post above. The green curve is my model (Ah = 50.4 -1.14*ln(km)) for battery aging discussed in an earlier post. It looks like my car’s capacity deteriorated more rapidly during the first kms than was normal for the German cars. On the other hand, my present mileage is 80,000 km and my battery capacity is now average or above average.

I suggested based on my own data that the natural log model was probably the best description of battery aging, but the German data doesn’t support this conclusion. In fact it looks linear more than anything else.

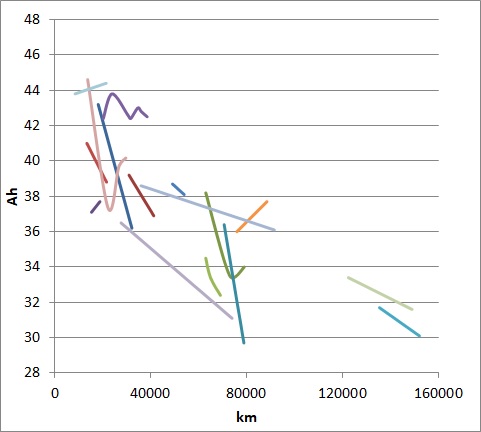
Of the 44 cars 16 owners reported more than one capacity measurement. These are shown as lines in the graph below.


Some show a sharp decline in capacity early in the car’s life and others a slower decline in capacity later in the car’s life. However there is no statistical difference in the rate of decline between low mileage and high mileage cars. What is interesting is the wide range of the rates of decline. This may be due to variations in the manufacture of the battery cells but it could also indicate that there are things that we can do or avoid doing that will extend battery life.

In my case I bought my 2012 CZero in 2014 from a dealer. The car had no previous owner and less than 2000 km. Other than that, I don’t know how it was treated. When I first saw the car, it was in the dealer’s showroom with the charger connected. From 2000 km to 40,000 km we quick (Chademo) charged the car. Since 40,000km we have slow charged 70% of the time. I usually slow charge between the hours of 10 in the evening and 7 in the morning and the car isn’t charged up every day but on the average every second day.

Thanks to datom for the use of his data.
 
CZeroOwner said:
The black dots in the graph above are battery capacities for 44 German owned iMiev/CZero/iOns collected by datom.
Let's remember that this is the capacity as reported by the on-board BMS. The fact that range can miraculously be restored (real-world, achieved range) after the "battery smoothing" process suggests to me that perhaps the BMS is overly pessimistic about degradation. Perhaps Mitsubishi are happy with this; mostly this should be invisible to the user, and it causes less real depth of discharge, saving the battery (at the expense of potentially a lot of customer inconvenience).

This is one of the reasons that I'm attempting to reverse engineer the firmware. Progress is slow, unfortunately, mainly due to time availability.

What is interesting is the wide range of the rates of decline. This may be due to variations in the manufacture of the battery cells but it could also indicate that there are things that we can do or avoid doing that will extend battery life.
Indeed. Or it could be the BMS being overly cautious / pessimistic. It would be really good to know which it is.

[ Edit: removed graph from quote. ]
 
Coulomb, thank you for your ongoing efforts. I'll throw in another data point. I'm planning to replace MR BEAN's battery with a junkyard salvage unit shortly after 100k miles, currently at 99,220 on the odometer.
Current stats according to my MUT3 clone:
Battery current capacity: 27.3 Ah
Battery maximum input power: 45.75 kW
Battery maximum output power: 63.50 kW
Voltage spread between high and low cells is now as high as 0.19 V.

DCFC sessions are running significantly longer these days with a degraded battery plus temperatures near freezing. The pack warms up nicely, perhaps too warm at 39 Celsius (102 F) on module 3 and ten degrees C cooler elsewhere in the pack.

I haven't noticed any significant reduction in power/acceleration, and the max output capacity of 63.5kW at low SOC certainly confirms that there's plenty of power to spare versus our 49 kW traction drive.

That means the old pack still has promise for mobile reuse. I plan to first try it as a trailer-mounted range extender, and then consider packing the cells into one of my collector EVs, where 30 miles of range would be easier to live with. MR BEAN is displaying 41 miles RR most frosty mornings, which is pretty much spot-on, as I often head for a DCFC 38 miles away and arrive with 1 or 2 bars.
 
jray3 said:
Coulomb, thank you for your ongoing efforts. I'll throw in another data point. I'm planning to replace MR BEAN's battery with a junkyard salvage unit shortly after 100k miles, currently at 99,220 on the odometer.
Current stats according to my MUT3 clone:
Battery current capacity: 27.3 Ah
Battery maximum input power: 45.75 kW
Battery maximum output power: 63.50 kW
Voltage spread between high and low cells is now as high as 0.19 V.
Just so you know, the maximum input power and maximum output power figures are not a measure of the health of the battery with respect to degradation, so you won't see any difference here between an old battery and a new one.

They're actually real-time figures used by the BMS to inform the MCU and other peripherals what the maximum amount of power the battery can supply or receive at any given time so that charging/regen/discharging are limited to remain within these safe limits. These limits are based on the current SoC and cell temperatures.

For maximum input power (charging, regeneration) this is severely limited at 100% SoC (only about 8kW) and gradually increases to 45.75kW by the time you get down to (approx) 80% SoC. It is also affected dramatically by temperature. Below 12C it is limited to no more than about 24kW, and below 0C it is down to around 12kW. (approximate figures off the top of my head)

This limit affects both regeneration and rapid charging, although I have noticed that at high SoC it still doesn't charge as fast as this maximum input power limit, however that may be due to me having a couple of cells with higher than normal internal resistance. (Which limits rapid charging speed)

High cell temperatures would also limit maximum input power however I think the cells have to be well past 40C before it will start to limit charge rate and it's rare to get the cells on these cars that hot. (At least in the UK!)

Maximum output power limits maximum acceleration, however this figure doesn't vary nearly as much. It does drop a little when you get down to about 10% SoC, (which is why turtle mode can limit acceleration) and it may also drop slightly at below freezing temperatures or cell temperatures above 40C, but only a little.

So looking at these two figures at a random SoC or cell temperature doesn't really tell you much of anything.

At cell temperatures between 12C and 40C and SoC between about 20% and 80% I would expect these two figures to be at their maximum.
DCFC sessions are running significantly longer these days with a degraded battery plus temperatures near freezing. The pack warms up nicely, perhaps too warm at 39 Celsius (102 F) on module 3 and ten degrees C cooler elsewhere in the pack.
If it was only the cell capacity that has degraded then rapid charge times would actually get faster. The thing that slows down rapid charging time is increased cell internal resistance, which is usually a sign of cell(s) that are starting to fail prematurely.

I know this first hand as in the last year two of my cells have dropped significantly in capacity relative to the others and their internal resistance is higher as well. This high resistance causes them to reach the peak cell voltage of 4.105 volts too early during a rapid charge (at a lower than usual SoC) and as a result the BMS is forced to throttle the rapid charge rate back sooner than it should have to, even though all the other cells could take a higher charging rate.

This can clearly be seen in the Canion voltage graph - the two high resistance cells get to 4.105v very quickly during the rapid charge while the rest are around 4.075v at the same charge rate - those other cells could take a much higher rate before hitting 4.105v.

When i first got the car it would maintain the full 43kW up to about 55% SoC and stay above 22kW up to about 70% in warm weather. (Cells 20-30C)

Now with two high resistance cells even if I start at 20% SoC in warm weather it will only remain at the full 43kW until about 30% SoC, and is down to about 22kW by 50% SoC, 11kW by about 70% SoC and 7kW by 80% SoC.

Charge time from 20% to 80% used to be about 18 minutes, now it's about 28 minutes with the last 10% being really, really slow! (And sometimes it shuts itself off at 70% ish instead of waiting until 82% like it used to, so I have to restart it to get to 82%)

If you have Canion it's fairly easy to test for individual cells that have high internal resistance - first you have to get the battery quite warm - all cells between about 20-35C, ideally 25-30C as that gives minimum cell internal resistance and maximum rapid charging speeds. Not easy in winter but possible if you do a couple of speedy motorway sessions with a rapid charge in between.

Before charging, take a note on Canion of any cells that have unusually low voltage compared to the rest at 20% SoC. These cells are ones with lower capacity and potentially (but not necessarily) have high internal resistance as well.

Put it on a rapid charge and watch the cell voltage graph - if you have a weak cell that also has high internal resistance what you'll see is that before the charge it had a lower voltage than most other cells but during the charge it's voltage will almost immediately go higher than most other cells - if it goes from lower than the others to significantly higher than the others quite quickly on a rapid charge this is a sure sign that the cell has higher internal resistance as it will cause the voltage to be excessive under charge.

If you continue to monitor it until the charge rate starts to drop below 43kW you would see the high resistance cells sitting pegged at 4.105 volts, while other cells may be 20-30mV lower. That's what I see on mine anyway.

If I could get my hands on a couple of good cells I'd be tempted to replace them, because while I can put up with some capacity loss (now down to 35.2Ah after a series of large drops from the 39.9Ah I had two years ago) the much slower rapid charging speed is a real pain in the behind when I do actually want to rapid charge.
 
Hi Simon,

I'm awaiting delivery of an 8-cell module, as long as the cells are good then i'll be selling most of them as I dont need them.

There is also a guy on ebay UK who sells them and someone in europe on facebook who strips down EV batteries and sells the cells (not on the sea shore...).

Thanks,

Gary.
 
krox said:
Is there a software for checking the HV battery capacity for Android?
There are several.

Canion, Hobdrive, and Evbatmon will all give the HV battery Ah capacity.

Canion is free but requires a more expensive STN11xx adaptor (such as OBDLink LX) and will not work with a cheap ELM327 adaptor.

Hobdrive has a free version and will work with a cheap ELM327 adaptor so is probably the cheapest outlay to read the battery capacity if you already have an Android device.

I have used both apps and they are both useful tools to have besides just giving the Ah reading.

EVbatmon is expensive and won't do anything else other than give battery capacity so I can't recommend it.
 
Back
Top