Battery Capacity Testing

Mitsubishi i-MiEV Forum

Help Support Mitsubishi i-MiEV Forum:

This site may earn a commission from merchant affiliate links, including eBay, Amazon, and others.
Forgive me if I've missed it as I've only skimmed this thread, but in all your recording of battery measurements for your car, have you ever checked the spread of capacity of the individual cells, or are you only recording and plotting the overall usable pack capacity reported by the BMS.

This is a very important factor, because without checking the capacity of individual cells (which can be roughly estimated by their relative voltages at a low SoC like 20%) you can't be sure whether what you're seeing is normal expected degradation (all cells degrading roughly equally) or whether you're seeing one or more substandard or failing cells bringing the capacity down below what it should be.

For example in my car the spread of cell capacity goes all the way from about 33Ah to 40Ah in the same pack from worst to best cells, yet I have seen at least one other C-Zero where the cells were all almost perfectly balanced in capacity even at a relatively high mileage.

Clearly in my pack some cells have not been as reliable or durable as others, and this possibly points the finger at poor quality control during cell manufacturing or testing.

If you're lucky and you get all "good" cells in your pack it will last well, if you're unlucky and you get one or two "bad" cells in your pack the usable capacity will degrade a lot faster than normal...
 
Hi Simon

The guy at the shop said that there was little difference between the cells.

I believe that the degradation I'm seeing is due to the expected degradation of otherwise health cells from cycling and storage time but I'll check on the voltage difference between cells at low SoC.
 
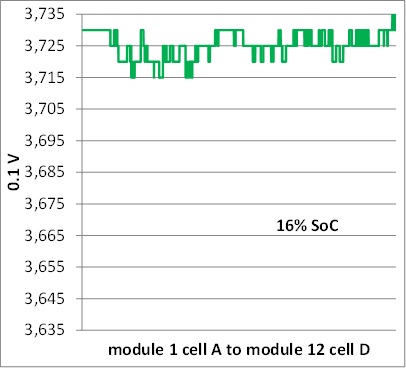
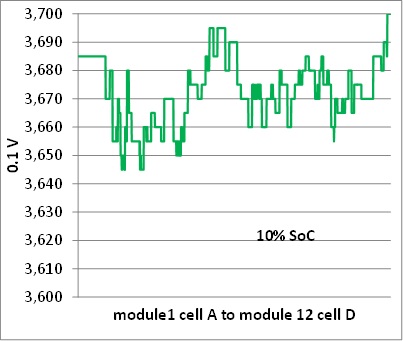
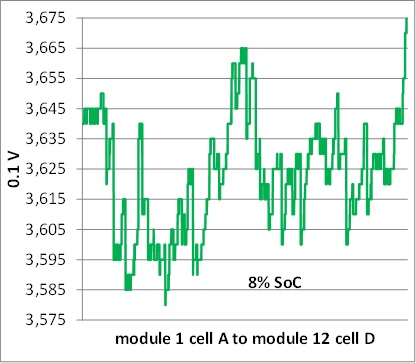
DRMandrake asked for more details on the voltage differences between the cell in our car. Here 3 graphs showing the cell voltages at difference SoCs. The data for the first graph was collected on June 17 2019 and the second and third graphs are from April 13 2019. Note that the difference between the top and bottom of the y axis in all 3 cases is 0.1 volt.


The difference between the max cell voltage and the minimum cell voltage increases dramatically as the SoC decreases. The cell module 3 cell E has the lowest voltage at all 3 SoCs and cell module 12 cell D has the highest voltage.

David
 
20mV spread at 16% SoC is very good!

From memory mine is now about 125mV at 20% Soc.... :(

Above 2/3rd of that spread is just due to the few cells I will be replacing however so I'm expecting it to drop to around 40mV at 20% SoC after my cell swap.
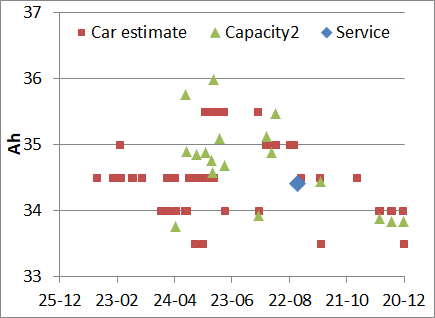
 

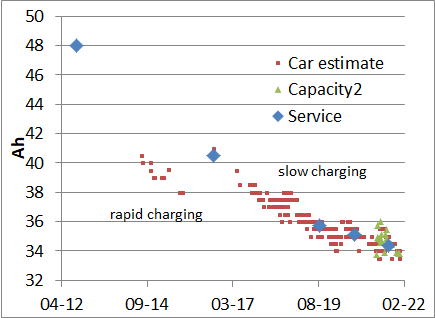
Figure 1 2012 to 2021

Figure 2 December2020 to December 2021

The graphs above show all the measurements of the battery capacity of our CZero. We bought the car in July 2014 almost two years after it was imported into the country. At that time it had only been driven 2000 km. The present mileage is 120,000 km

The car’s estimate of the capacity is one of the data points broadcast on the cars CAN network and recorded by the OBDZero app. The capacity 2 is a measurement performed using the OBDZero app. This function was added to the app in April 2020. Capacity 2 is independent of the car’s estimate. The service capacity is the capacity measured by the Citroën service department as part of service on the car. Since the warranty on the car ran out we have payed €180 for this measurement.

Figures 1 shows the overall downward trend in the capacity. However it also shows that the trend slows with the age and mileage of the car. Figure 2 shows short term variation in the capacity. This can be as much as 2 Ah. It increases during the summer and decreases during the winter, which indicates that temperature has an effect on the Ah capacity.

In figure 1 the first service capacity, 48 Ah, is in fact the capacity the manufacturer expects the battery to have at the time a new car is delivered to the dealer. Reports from other car owners indicate that this estimate is correct +- 1Ah. The car’s estimate of the capacity from 2014 to 2016 is well below a line connecting the expected capacity in 2012 and the first service measurement in 2016. In other words the car’s estimate was much lower than expected based on the service measurement. I believe this is an error in the car’s estimate of the capacity, not a true change in the capacity due to rapid charging. The car was slow charged just a few times during this period and the car only measures the battery capacity while slow charging. So there were just a few opportunities for the car to correct its estimate. Under these conditions the estimate drifted downward. This may be a safety feature built into the battery management unit. It prevents an overestimate of the remaining range. In September 2016 the car’s estimate was reset by the service center to the service measured capacity. Since then car has been slow charged at more than 80% of the time. Figures 1 and 2 show that the car’s estimate, the service measurement, and the capacity 2 measurement agreed fairly well since the correction in 2016.
 
CZeroOwner, thank you for posting the data for your car as well as your previous graphs and analyses. Now that our cars are getting on to 10 years, the age degradation of our original LEV50 cells means that they should be around 33Ah by now.
Ref: http://myimiev.com/forum/viewtopic.php?f=23&t=2386&start=50#p39274).
One of my two 2012 i-MiEVs shows 32.8Ah at around 50K miles, but my neighbor's 2012 is sitting at 27Ah at 71K heavily-used miles. Happily, my other i-MiEV had its battery replaced six years ago and is sitting around 37Ah with only about 50K miles on the replacement battery (presumably LEV50N).

Whereas in the past we used to stop charging at around 12 bars, we now are going up to 14-15 bars in our daily charging, and fully-fully charging at least a couple of times a month (usually inadvertently). Disconcerting to see our RR rarely getting above 55 miles.

Do we have a consensus on what we should be doing regarding resets or recalibration or altering our charging regimen?
 
Thanks for the positive feed back. Your question is a good one. We have two CZeros both from 2012. The one above has 120,000km while the other has only 30,000 km. Its battery capacity is still 38.5 Ah. When I do charge the cars I always charge to 100% but I wait as long as I can before charging. The second car has only 13 km RR right now and it's been that way for some days. We bicycle a lot so we don't need to use the car every day. However the lower air temperature here in Denmark, the yearly average is 10oC, probably slows degradation in comparison to California.

Based on the data in the graphs shown above I don't trust the car's estimate of the battery capacity. I think it often under estimates the true capacity. Only when all three measurements agree do I feel confident in the estimate. What I hope is that many try the Capacity 2 measurement in OBDZero and compare it with the car's estimate. I suspect that some will discover that their battery is in better shape than the car thinks it is.
 
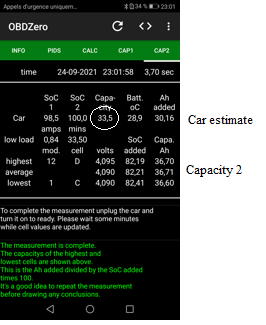
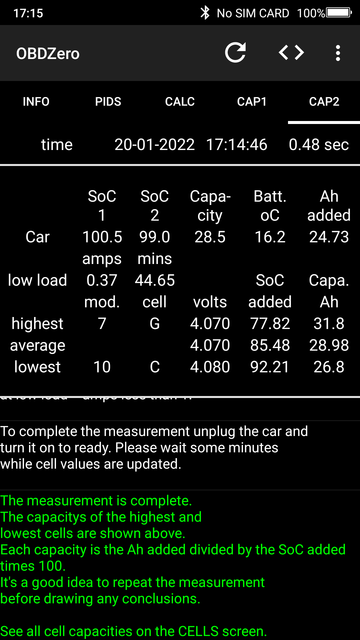
Here is screen shot from a OBDZero user who measured his battery using the Cap2 function in the OBDZero app

Screenshot-20210924-230159-001.png


Note that Cap2 capacity is 36.7 Ah while the car capacity estimate is 33.5 Ah. That the car estimate is less than the measured capacity is something others have observed. For some of you Cap2 may show that your battery is in better condition than indicated by the car. On cars before 2016, once the measurement is complete, you can select the CELLS screen and see the capacities of all the cells. Unfortunately the individual cell data is not transmitted on the car's CAN network for cars after 2015. The Cap2 function still works on cars after 2015.

I would very much appreciated if you tried the Cap2 function and report your results to me. We need to be sure that we know the true state of the battery before we can judge the rate of battery degradation relative to age and mileage. Accurately measuring the rate of degradation is the reason I added the Cap2 function to OBDZero.
 
CZeroOwner, thank you for the posts. I have an old Android tablet which I've been using with CaniOn and OBDLink MX bluetooth adapter, but with that combination I couldn't get OBDZero to link up. I haven't tried my old STN1170 adapter. Which specific ELM adapters do you suggest?
 
Hi JoeS
OBDZero has worked with the OBDLink LX earlier. I haven't checked it recently because a friend has my LX. I have tested it with most of the VGate's bluetooth dongles, they were kind enough to send samples, and they worked well. Right now I'm using VGate's vLinker FD+ and it works very well. The data collection cycle with the FD+ takes about 1 sec which is almost as fast as the LX. I have also tested older dongles some of them pirate copies and most of them worked but were much slower, 3 to 4 sec. for a cycle and had problems linking. For the capacity measurement, speed isn't critical so 3 to 4 sec. is good enough.

OBDZero uses only standard AT commands so in principle it should work with any standard dongle including your STN1170.
I will test all the dongle I have again in case I have made a program change that excludes them.

More info is available in OBDZero's user manual that you can download from OBDZero.dk

I hope this helps.
David
 
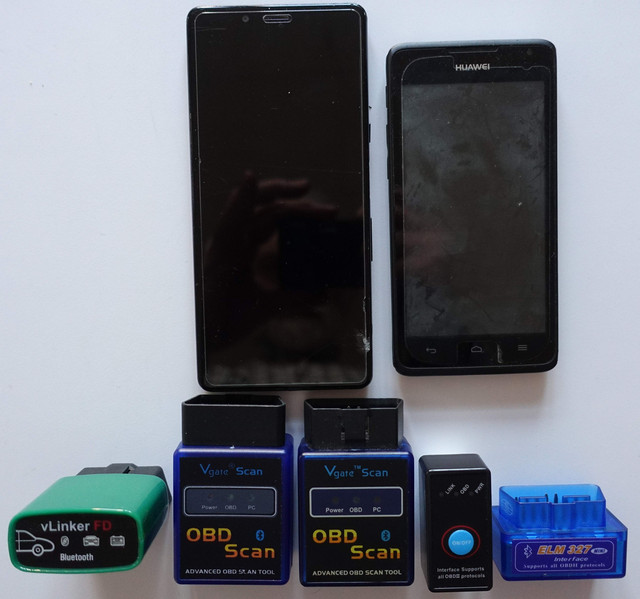
DSC08807.jpg


This photo shows the dongles and the phones I have just tested. The phones are a Sony running android 8.1.0 and a Huawei running Android 4.3. This is the earliest version I've tested. Both phones connected with all the dongles. Below the phones are the dongles in order of quality from left to right. They are:
VGate vLinker FD+ connected with 1 try, fast and error free data
VGate Scan connected with 1 try, slower but error free data
Scan pirate copy note the reversed connector, connected with 1 try, slower and with data errors
INTEY OBDII connected after 3 tries, slower and with more data errors, barely usable
ELM 327 mini (< $10) connected with 1 try, very slow and with too many data errors, unusable.

One thing that helps on rare occasion is to turn off WiFi.
I'll ask my friend to test the OBDLink LX.
 
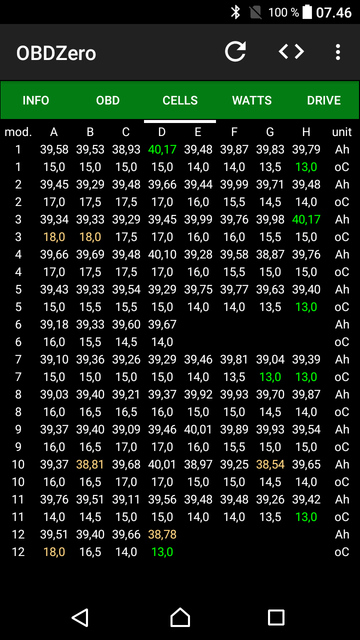
Screenshot-20211016-074655.png


This is a screen shot from the OBDZero app. It shows the capacity of each cell in the battery. This screen is available when an OBDZero capacity 1 or capacity 2 measurement has been performed. A capacity 2 measurement is more accurate than a capacity 1 measurement however a capacity 1 measurement can still be used to compare cells. In the case above there is less than a 2 Ah difference between the best and the worst cells. This indicates that the battery is in good condition. Unfortunately Mitsubishi changed the CAN programming and there by stopped sending individual cell data on the car CAN network for car produced after 2013 or 2014. In which case the capacity 1 and capacity 2 can only report the capacities of the best and the worst cell with no indication of which cells they are.
 
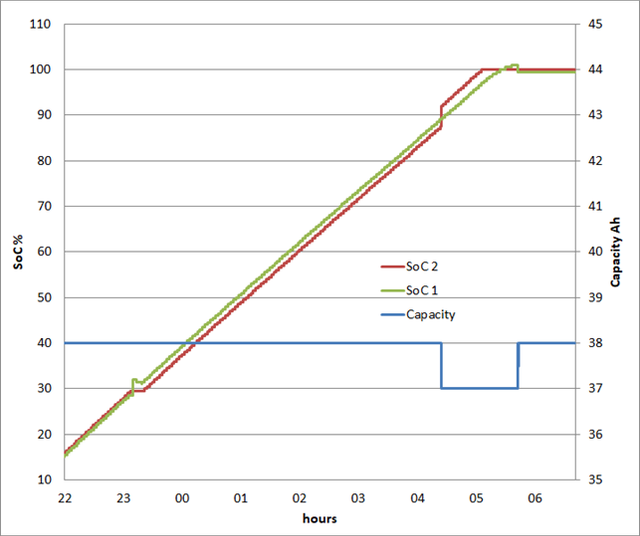
This graph shows a slow charge with 2 changes in the car’s battery 100% capacity estimate. I have search my data and I have only found 1 time when the car’s estimate may have changed when the car wasn’t slow charging. The capacity estimate does not change while rapid charging.

Cars-Estimate-Capacity.png


The steps in the process the car uses to estimate the battery capacity are:
• Charging stops for about 5 min. at 30% SoC1 (or in some cases 70%) so that the BMU can measure the true SoC. SoC1 (green line) is adjusted to the true SoC in this case 31.5%.
• At 89% SoC1 the BMU changes the capacity estimate (blue line) and SoC2 (red line) based on the change in SoC1 and the Ah accumulated in the battery since the 5 min. stop.
• When SoC2 reaches 100% it stops increasing even though the battery is still charging.
• When the cells are all at 4.1 volts (balanced) charging stops.
• After about 5 min. with very low current SoC1 is again adjusted to the true SoC, in this case 99.5% and the capacity estimate is adjusted at the same time.

This process occurs every time the car is slow charged from less than 30% (or 70%) SoC1 to all cells balanced at 100% SoC2. The capacity estimate is only changed when the process indicates a significant change (> 0.25 Ah) in the capacity.

SoC2 is the State of Charge that e.g. the CaniOn app shows as SoC. (It is the second byte in PID 374 while SoC1 is the first byte.) Apart from the changes shown above both SoCs are “coulomb counters”. That is they change in proportion to the measured Ah to and from the battery.

The true SoC is computed based on the open circuit voltage. During the 5 min pause in slow charging the voltage of the battery drops to toward the open circuit voltage. The true SoC cannot be computed unless charging pauses.

The basic computation is Capacity = Change in the Battery Ah / (Change in the true SoC/100).
However I have not figured out the details of the computations the BMU performs.

The car’s estimate of the capacity will be in error if:
• the car is only rapid charged
• the car is not discharged to less than 25% and then charged completely at least once a month and preferably more often.

The estimate is more accurate if the pause in charging is at 30% rather than 70%. Not all slow charging must be done completely. It appears that the error is more often to the negative side. That is, the car’s estimate is less than the true capacity.
 
Here is my measurement of the capacity using CAP2. Citroen C-Zero Year 2011 at 62000 km on Odometer (If it is real. Now I'm not sure about that)


The capacity is from the latest rows in the file Cells_...txt. I forgot to take a screenshot of the Cells tab

I'a using CanIon for 2 years now and I track the capacity. The BMS was reset when I got the car. Some time later, using the diagnostic tool, I reset it again by mistake. It took a couple of mounts to reach the real capacity back.

Now I've noticed that the capacity drops by 0.1 for every 400-500 km. From 34.5 to 29.2 in a year and 10k km. For now it works for me. Everything seems balanced if I don't go under 20% and the battery is not bellow 10 degrees Celsius. When it is colder and at low state of charge every high consumption or rapid acceleration can trigger the turtle light.

I hope it can make another year or two before it goes under some battery maintenance.

Thank you CZeroOwner for the effort to give us such a tool. If you want I can send you the TXT files
 
Hi kirq4e

Thanks for your kind words about my app. Yes please send the txt files. I would very much like to see them.

Your battery capacity is decreasing faster than I would expect. For 1 year and 10,000 km I would expect a drop of about 2 Ah. The 5 Ah difference between the best and the worst cell is also large. The car measurement and the capacity 2 measurement agree so I don't think it is a error. Another thing is that there are a number of cells with about the same low capacity as 10 C, the lowest cell. In other words it probably isn't just 1 cell dragging the battery down. On the other hand that would be the first cell to replace.

Your capacity isn't very low for your car's age and km. Here is a German forum with a list of our cars with age, km and capacity.
https://www.goingelectric.de/forum/viewtopic.php?f=222&t=23324&hilit=iMiev&start=270
No. 114, 4, 119 and 20 all have capacities similar to your car. The BJ date is the date the car was built and the EZ date is the date the car was imported into Germany.

That's another thing. If you haven't already done it, you can check your car's build date using the VIN no. and this web site:
https://www.vindecoderz.com/EN/Citroen

The factors that reduce battery life are high temperature, long periods at high SoCs (> 80%) and possibly many km at low (turtle) SoCs. I have seen some lab measurement that show a drop in capacity if a lithium cell is operated at less than 10% SoC. Does any of this make sense to you. E.g. is the average yearly air temperature high where you live? Where I am it is 10oC.

Cheers
David
 
I have a 2012 Ion with 51k kilometres on the odometer. I would like to know the SoH of my battery pack. The suggestions in this thread are alle very good and I'm thinking about buying a good ODBII adapter and software to read out the car. But I'm also thinking about a quick-and-dirty way to measure the remaing Ah of my battery pack:

My 2012 Ion has 88 cells at 3.7 volts each = 325 v. Is it possible to just drain the car to an (almost) empty battery, then hook it up to a public charging point and just look up in the charging app how much kWh was needed to obtain to get the battery at 100% again? This way it's possible to calculate the Ah of the car, e.g.: if the charging point delivers 12 kWh in total, isn't the Ah then simply 12000 Wh / 325 v = 36.9 Ah? And if it loads only 11 kWh, then it's 11000 Wh / 325 v = 33.8 Ah? I would like to think that this is a way to measure the battery degradation over time.

What are your thoughts?
 
Back
Top