tinoale said:
So are we saying there is a simple way to measure battery available Wh by fully charging it, reset canion trip, turn the heater on while the car is parked, and leave it as is until the heater stops ? (BTW at what SoC does the heater stops ?)
If that's so simple we have a simple and easily repeatable method to compare our batteries capacities, don't we ?
Yes, that's how I did, see post
http://myimiev.com/forum/viewtopic.php?p=18034#p18034 but a full discharge is not helpfull and not to advise.
I just drew a graph Wh out versus SoC, you get the graph below showing steps because SoC resolution is of 0.5 %.
The slope of an average straight line or the ratio delta Wh out divided by delta SoC give the full battery capacity. "Delta" means a subtraction between two values,
(Wh out 1 less Wh out 2) divided by (SoC 1 less SoC 2 ).
Why a full discharge is not to advise and not helpfull.
Full discharge is not good for a battery and anyway the car computer will forbid a 16.28 kWh discharge.
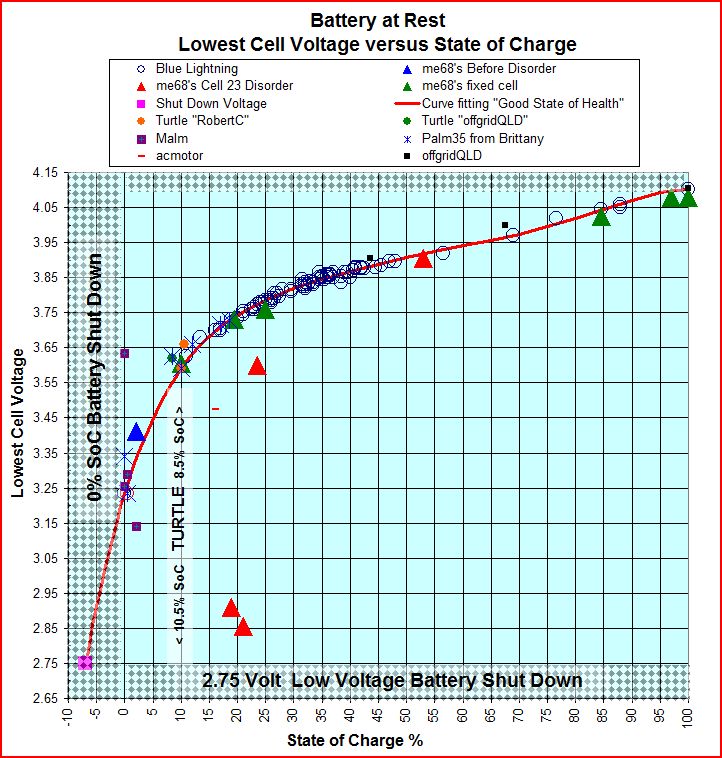
Also, around ten per cent SoC, as you can see on my graph below, the car computer stops the heater, by the way I didnt get the turtle.
Why wasting electricity?
I think Peugeot use the heater for their battery checking they do every two years, but I am missing their exact protocole.
For me, cells equilibration and SoC calibration
http://myimiev.com/forum/viewtopic.php?p=18067#p18067 is necessary to get a proper curve Wh out versus SoC before a battery capacity test.
Peugeot or Mitsubishi might do a discharge below two bars and then make a full charge, before to proceed to this battery capacity test.
I use SecLog data to proceed this capacity test, but if you are more at ease to use the Wh out given by CaniOn on the right side of the screen to draw this kind of graph,
be sure you pick up the Wh out only when there is a change of SoC otherwise the average curve slope will be wrong and so on the battery capacity.
If you are aware of this "step" or "0.5 % SoC resolution" problem, a single measure of "delta Wh out" divided by a "delta SoC" will give an accurate result, I did a discharge of around 1 kW-h for more accuracy but 0.5 kW-h would have given the same accurate result.
For my test, the curve's slope was 0.1624 kWh per % SoC, or 16.24 kWh for 100 % SoC which is the Battery capacity.
It's a pity Canion doesn't provide graphs versus SoC instead of time, by example, a simple curve like Volt versus SoC would give informations about the evolution of the battery State of life or when the battery calibration occurs.
State of Health Estimation of Li ion Batteries: Cycle Life Test Methods, http://komar.bitcheese.net/files/JensGroot.pdf See curves Voltage versus SoC or Voltage versus Capacity giving informations about Battery State of Life, pdf, page 97 or Paper page 85, Chapter 7 Cell Ageing Analysis, 7.1 Galvanostatic Voltage Profiles
 Capacity Battery measurement