SF Peninsula --> Capitola and Back Over Hwy. 17 1800ft. Summit
Trip from my house (Los Altos Hills) to Capitola was 41.2 miles. I started with 16 bars and RR of 94 and arrived in Capitola with 9 bars and RR of 49. Temperature a little under 70degF. No heat or aircon, but driving lights on (not headlights).
Fully recharged in Capitola.
Returned home, starting in Capitola with 16 bars and RR of 93 and arrived at home with 5 bars and RR of 20 for a trip distance of 40.8 miles (slightly different route). Temperature around 50degF and headlights on. No heat or aircon.
I recorded data points going but inadvertently disabled my recorder coming back. Graph below is for the trip going out.
I drove conservatively on the way to Capitola, and the uphill drive was slowed by construction and a 40mph speed limit. This made a significant contribution to extending the range. On the way back, I was much less conservative.
Regeneration on the long downhills not only resulted in my RR increasing but the fuel gauge bars also increased (by one bar) a few times.
Another observation - I'm beginning to wonder if our Fuel Gauge is linear; i.e., the first eight bars drop slower than the last eight bars. Don't have enough data to support or refute this, but it's something worth keeping an eye on...
ASSESSMENT
In an earlier post I allowed as I thought the typical high-speed highway range upper limit is around 50 miles, and I'll stick with that for planning purposes; however, the iMiEV is really responsive to gentler and slower driving and I'm sure a range of 80 miles is readily achievable on lower-speed roads. The good news here is that if there is any concern at all of being able to get to a destination, then simply slowing down and picking a gentler route will dramatically improve the situation. Heck, if I believed the instrumentation, it told me that on the outbound trip, after covering 41.2 miles I still had a RR of 49 miles... then I'd have been able to have gone over 90 miles.
EV drivers don't have range anxiety because we have a very good handle on what our range is! :!: That's why all this data-taking at the outset.
For ourselves, now that we've tested and taken enough data to be comfortable, we're going to be quite content keeping our fuel gauge between six and fourteen bars for our everyday driving, content in knowing just how far we can push it if we have to.

Edit 11/2/16
OMG, I didn't realize that the PDF doesn't show up as an image.
(Apple's Safari shows it whereas Google's Chrome doesn't)
Here's the link: http://www.katiekat.net/Vehicles/Mitsi/MitsiCapitolaTripGraph.pdf
Edit 4/30/17
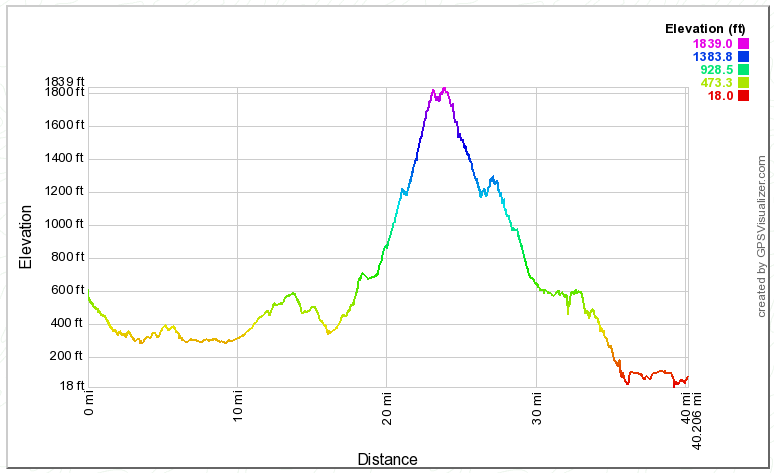
Added the GPS Visualizer graph of this trip:

Trip from my house (Los Altos Hills) to Capitola was 41.2 miles. I started with 16 bars and RR of 94 and arrived in Capitola with 9 bars and RR of 49. Temperature a little under 70degF. No heat or aircon, but driving lights on (not headlights).
Fully recharged in Capitola.
Returned home, starting in Capitola with 16 bars and RR of 93 and arrived at home with 5 bars and RR of 20 for a trip distance of 40.8 miles (slightly different route). Temperature around 50degF and headlights on. No heat or aircon.
I recorded data points going but inadvertently disabled my recorder coming back. Graph below is for the trip going out.
I drove conservatively on the way to Capitola, and the uphill drive was slowed by construction and a 40mph speed limit. This made a significant contribution to extending the range. On the way back, I was much less conservative.
Regeneration on the long downhills not only resulted in my RR increasing but the fuel gauge bars also increased (by one bar) a few times.
Another observation - I'm beginning to wonder if our Fuel Gauge is linear; i.e., the first eight bars drop slower than the last eight bars. Don't have enough data to support or refute this, but it's something worth keeping an eye on...
ASSESSMENT
In an earlier post I allowed as I thought the typical high-speed highway range upper limit is around 50 miles, and I'll stick with that for planning purposes; however, the iMiEV is really responsive to gentler and slower driving and I'm sure a range of 80 miles is readily achievable on lower-speed roads. The good news here is that if there is any concern at all of being able to get to a destination, then simply slowing down and picking a gentler route will dramatically improve the situation. Heck, if I believed the instrumentation, it told me that on the outbound trip, after covering 41.2 miles I still had a RR of 49 miles... then I'd have been able to have gone over 90 miles.
EV drivers don't have range anxiety because we have a very good handle on what our range is! :!: That's why all this data-taking at the outset.
For ourselves, now that we've tested and taken enough data to be comfortable, we're going to be quite content keeping our fuel gauge between six and fourteen bars for our everyday driving, content in knowing just how far we can push it if we have to.
Edit 11/2/16
OMG, I didn't realize that the PDF doesn't show up as an image.
(Apple's Safari shows it whereas Google's Chrome doesn't)
Here's the link: http://www.katiekat.net/Vehicles/Mitsi/MitsiCapitolaTripGraph.pdf
Edit 4/30/17
Added the GPS Visualizer graph of this trip:


