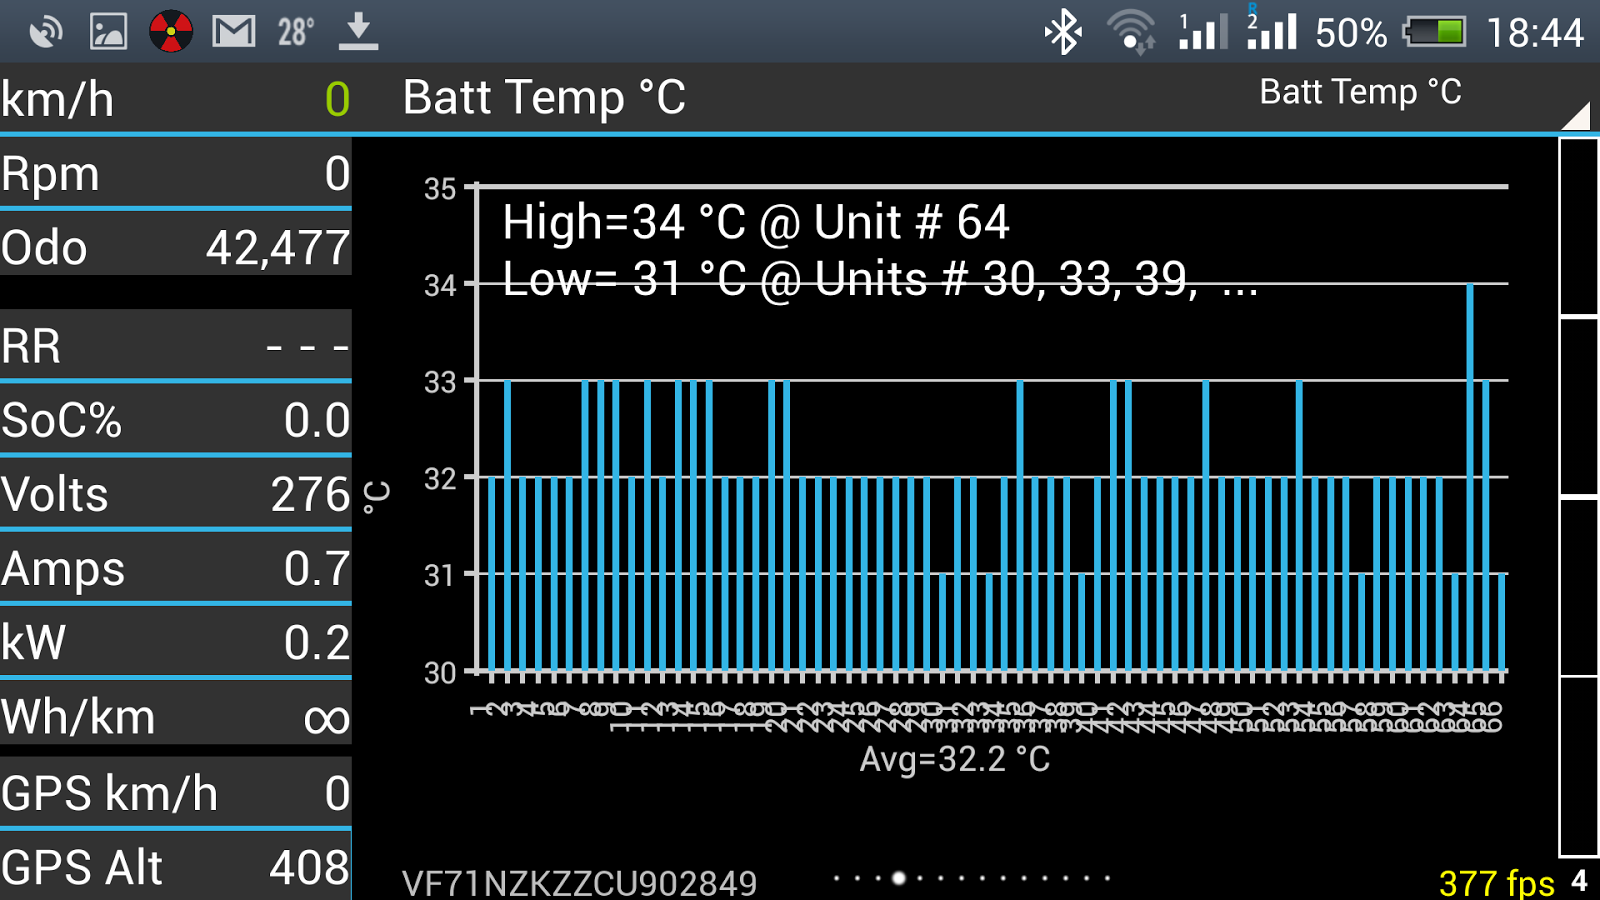
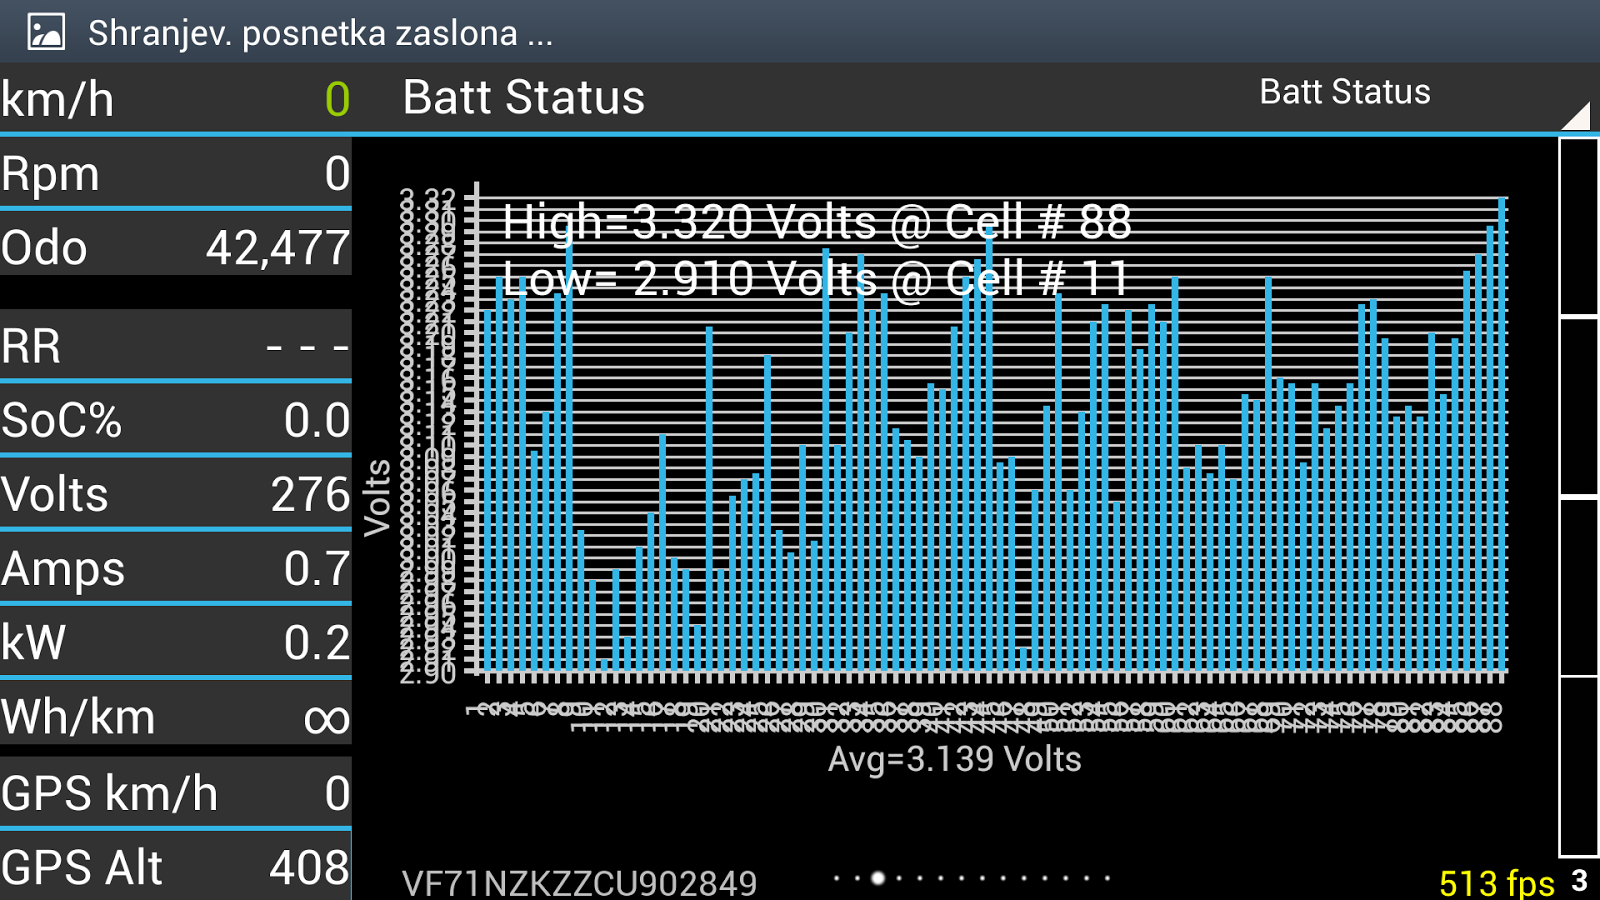
Thanks Malm to share with us your informations, you are on the path of those famous Portuguese navigators http://springday2004.planetaclix.pt/page15.htm taking us to some unknown territories.
With the help of one of your video, I picked up some data of one of your recharge to make a curve, Battery voltage versus State of Charge.
You reach 361 Volt at 80% SoC, my three years old Peugeot iOn on the road since two years with 20 000 km now, still reach 361 Volt at 96% SoC, we might suspect that less active components make the battery reaching 361 Volt at a lower SoC.
With the help of CaniOn and Seclog data, the conclusion is, that if you want to spend some holidays in a warm country, this is better to go Portugal than Normandy.
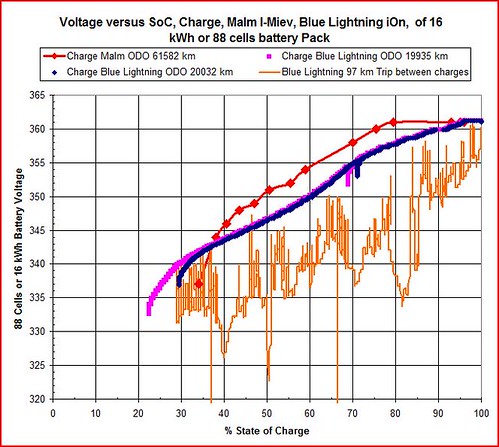 Battery Volt versus SoC with Malm
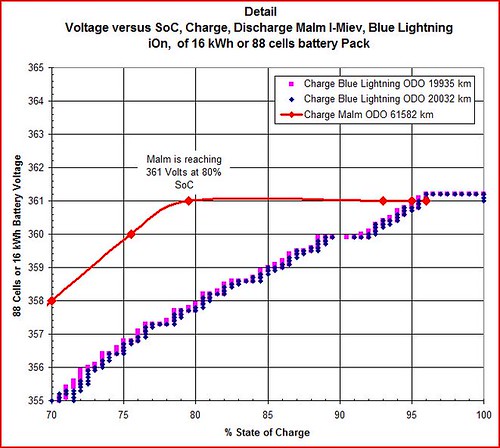 Battery Detail Volt versus SoC with Malm
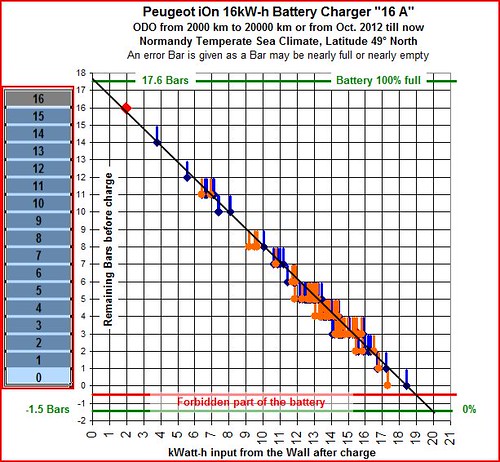 Remaining Bars versus Recharge at wall
Charge at the wall is monitored with a Kill A Watt
If the battery was empty, a simple line projection shows it would need 20 kwh for a full recharge at the wall with a Europe "16 A" 220 Volt Charger.
In other words, we do not need to empty the battery to see how much is needed for a theorical full charge at the wall.
Knowing the charge efficiency with a Europe "16 A" Charger, I could get the real charge of the battery.
By example, if the efficiency of the charge is of 82%, then the load in the battery is of 20 kwh at the wall multiplied by 0.82 which give 16.4 kW-h.
Recharge is always done without premature interruption at night.
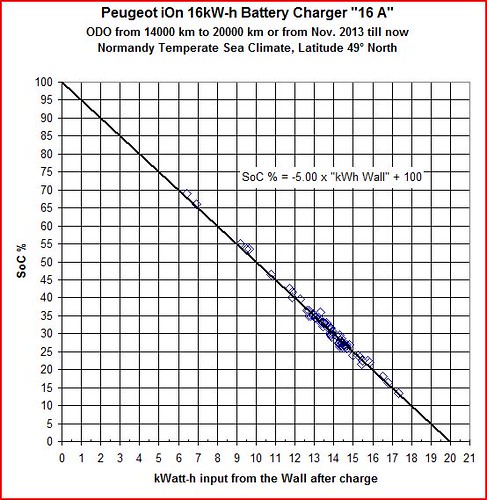 SoC versus Charge at the Wall
