Main Traction Battery Upgrade i-MiEV

Mitsubishi i-MiEV Forum

Help Support Mitsubishi i-MiEV Forum:

This site may earn a commission from merchant affiliate links, including eBay, Amazon, and others.
I had the thought of using the weakest cell first. I didn’t use it because I thought pack voltage would vary less and be a more stable judge. I never tried it. Just driving the car I can’t tell any difference. As you pointed out in your data analysis it does seem to change the rate that SOC drops.
 
Looks like I found a bug in the storeSoC() function.

3.77370 V 28.09%
3.77470 V 32.69%
With a slight change in voltage in the range of 3.77370 - 3.77470V, the SoC changes by more than 4%.

This is a fairly large error.

This is visible as a red line on the function graph. It seems to me that there should not be such a peak.

storeSoC_bug_.png
 
Thanks for your input Frud. I'm sure there are improvements that will increase performance.

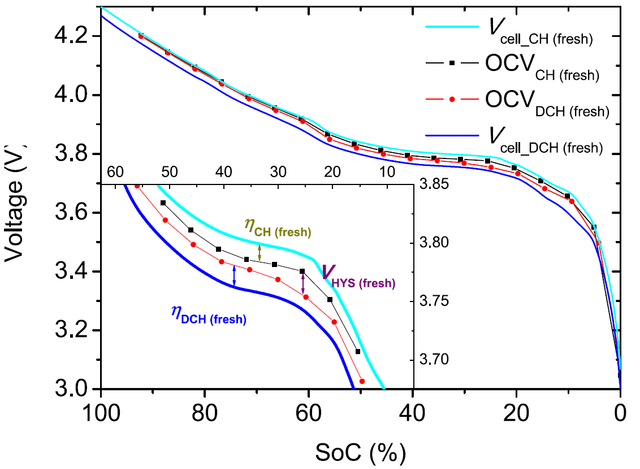
However please do not change the original code for the SoCv. The original code is a series of straight lines that match the low amp voltage v SoC curve in a scientific article on the NMC cell. It gives as precise as possible conversion of the low amp voltage to SoC.
Can I see the original voltage2SoC curve? I want to compare the resulting modified storeSoC function with the curve.
 
Frud said:
Can I see the original voltage2SoC curve?

Here it is Frud. And I have attached the article I found it in.

You bring up a good point here. This curve isn't smooth as one would expect. I have read that this is due to the lithium ions rearranging themselves in the anode or cathode as the ions move from one to the other. At steps along the way new lower energy levels become available. However I'm not an expert on battery chemistry.

NMC-OCV-curve.png
 

Attachments

  • s41598-019-51474-5.pdf
    1.3 MB
I think the article clearly shows that at the end of the day determining a SoC from a cell voltage depends on various variables (temperature, SoH and exact chemistry to name a few).

Is it therefore really necessary to try and calculate SoC so precisely or will a more simple approach be good enough as realistically we’re never going to utilise every last bit of NMC capacity anyway, not least to increase longevity?
 
MickeyS70 said:
Is it therefore really necessary to try and calculate SoC so precisely

The interesting thing about the SoC based on low amp voltage or open circuit voltage is it's stability. The current doesn't effect the SoC and because there are, in principle, no reactions going on in the cell the temperature has little to no effect. I've also looked at the curves from the time the capacity was 40Ah to 33Ah and I can see no significant difference in the relation between voltage and SoC. So SoH doesn't have much if any effect.

Therefore I think it is worth the effort to be as precise as possible.
 
Frud said:
The SoC changes by more than 4%.

Thanks for this correction Frud. It is because this line is missing from the code above:

} else if (volts < 3.7488) {
SoCv = 261.403598620641* volts -955.315988937822; return;

Using this line the SoC only changes by 1,5% points. I have also checked the number of significant digits and this line is just as good:

} else if (volts < 3.7488) {
SoCv = 261.404* volts -955.316; return;
 
The mode of use of NMC elements in solar systems and in transport differs significantly. In transport, the load current can suddenly change to limiting values and the voltage difference in individual elements can be significant and also accumulate over time. Therefore, in transport, balancing of elements is necessary.

You're right. Determining true SOC works better when using low cell voltage. I also wanted to use this option. However, I didn't know that the value of the minimum cell can be obtained directly, rather than sorting the results of reading an array of all cells. This is expensive in terms of CPU time.

Is it possible to obtain the internal resistance of the battery as well? I saw this value on the OBDZero screen. Is this a constant or does BMU actually calculate the internal resistance value using its algorithms?
Internal Resistance is reported by the BMU on request from test equipment.
When the command
761 2 21 1 0 0 0 0 0
is sent the BMU responds with
762 10 2E 61 1 5B 6D 1 71
762 21 1 1 5F 33 0D 8C 45
762 22 2 44 0 1 5E 1 5D
762 23 1 2C 0 FA 0 FB 0
762 24 0F 0F 1 B8 0 B3 B7
762 25 FE 0 0 1 5C 74 7A
762 26 64 0 12 0 0 0 0

You can see the internal resistance value in:
762 24 0F 0F 1 B8 0 B3 B7.
Value divided by 10. 15/10 = 1.5 mohm
First value is Internal resistance Maximum
The second is Internal resistance Minimum.
 
Here it is Frud. And I have attached the article I found it in.

You bring up a good point here. This curve isn't smooth as one would expect. I have read that this is due to the lithium ions rearranging themselves in the anode or cathode as the ions move from one to the other. At steps along the way new lower energy levels become available. However I'm not an expert on battery chemistry.

NMC-OCV-curve.png
I built a graph of the storeSoC() function and very accurately combined it with the graphs from the article. A significant discrepancy is visible. How can this be explained? I'm confused.

View attachment 443
 

Attachments

  • storeSoC_bug_.png
    storeSoC_bug_.png
    76.6 KB
Last edited:
Here it is Frud. And I have attached the article I found it in.

You bring up a good point here. This curve isn't smooth as one would expect. I have read that this is due to the lithium ions rearranging themselves in the anode or cathode as the ions move from one to the other. At steps along the way new lower energy levels become available. However I'm not an expert on battery chemistry.

NMC-OCV-curve.png
I built a graph of the storeSoC() function and very accurately combined it with the graphs from the article. A significant discrepancy is visible. How can this be explained? I'm confused.

storeSoC_bug_.png
 
Frud said:
I built a graph of the storeSoC() function and very accurately combined it with the graphs from the article. A significant discrepancy is visible. How can this be explained? I'm confused.

Hi Frud
You are certainly putting a lot of effort into this. The difference between the two graphs has to do with different 100% voltages. In the graph from the article 100% SoC is reached at a voltage above 4.2. In the iMiev the cells are only charged to 4.1 volts. This is exactly what your red curve shows 100% SoC at 4.1 volts.
Cheers
David
Thanks David. Now everything has fallen into place. What voltage is considered as 0% SoC?
 
Hello,
i gladfull for your work. i am also a owner of a peugeot ion. I already swapedd the bateries. Now i follow your disscuion about this CAN bridge.
 
Last edited:
Frud said:
What voltage is considered as 0% SoC?

Mitsubishi defined 100% = 4.1 volts and 0% = 2.75 volts for the original LEV50 cell. In the article on the NMC cell it looks like the authors defined 0% = 3.05 volts. In the specifications for a NMC 93 cells similar to the ones piev is using, the operating range is 2.75 to 4.2 volts. In principle piev can define 0% as he wishes as long as it is equal to or greater than 2.75 volts. Once defined then the capacity is the number of Ah between the 100% voltage and the 0% voltage
 
I loaded version 6 of my CAN bridge software with the corrections made by David. Thanks

I took a drive and looks like it is working beautifully. I don't understand their range estimator (most people refer to as GOM). It jumps from 178Km to 64km after I have been sitting in the garage for 10 minutes. The SoC had not changed for some time. I'm still not sure what data they use to calculate this value or if it's used for anything other than driving the display.

here is some of the data:

SoCOdometerKmBatteryVavgBat VolRangeShownRange in km
100.5​
227564​
0​
4.1​
360.8​
150​
241.35​
100​
227566​
2​
4.06​
357.1​
149​
239.741​
99.5​
227568​
4​
4.02​
353.6​
148​
238.132​
99​
227569​
5​
4.04​
356.7​
146​
234.914​
98.5​
227573​
9​
4.02​
353.6​
144​
231.696​
98​
227573​
9​
4.01​
353.3​
142​
228.478​
97.5​
227574​
10​
4.03​
355​
141​
226.869​
97​
227576​
12​
4.01​
352.6​
139​
223.651​
96.5​
227579​
15​
4.03​
354.5​
137​
220.433​
96​
227582​
18​
4.06​
356.6​
135​
217.215​
95.5​
227584​
20​
4.03​
356.5​
134​
215.606​
95​
227585​
21​
3.97​
354.2​
134​
215.606​
94.5​
227589​
25​
4.02​
354​
134​
215.606​
94​
227590​
26​
4.02​
354.1​
135​
217.215​
93.5​
227598​
34​
3.98​
349.8​
136​
218.824​
93​
227601​
37​
4.06​
357.4​
134​
215.606​
92.5​
227601​
37​
3.96​
349.2​
133​
213.997​
92​
227603​
39​
3.96​
349.2​
131​
210.779​
91.5​
227605​
41​
3.98​
350​
130​
209.17​
91​
227606​
42​
3.95​
348.1​
128​
205.952​
90.5​
227610​
46​
3.94​
346.7​
126​
202.734​
90​
227610​
46​
3.94​
346.6​
125​
201.125​
89.5​
227611​
47​
3.89​
343.5​
123​
197.907​
89​
227613​
49​
3.92​
345.4​
122​
196.298​
88.5​
227616​
52​
3.95​
347.7​
120​
193.08​
88​
227618​
54​
3.92​
346.4​
119​
191.471​
87.5​
227619​
55​
3.92​
345.7​
119​
191.471​
87​
227621​
57​
3.9​
344.6​
118​
189.862​
86.5​
227622​
58​
3.98​
349.2​
116​
186.644​
83​
227622​
58​
3.97​
349.1​
111​
178.599​
83.5​
227622​
58​
3.98​
349.3​
111​
178.599​
83.5​
227622​
58​
3.98​
349.4​
40​
64.36​
83.5​
227622​
58​
3.98​
349.4​
40​
64.36​
 

Attachments

  • Calc_2024_04_03_15_18_25.txt
    3.1 MB
  • OBD_2024_04_03_15_18_25.txt
    4.2 MB
  • PID_2024_04_03_15_18_25.txt
    5.3 MB
piev said:
The range estimator jumped from 178Km to 64km after I have been sitting in the garage for 10 minutes.

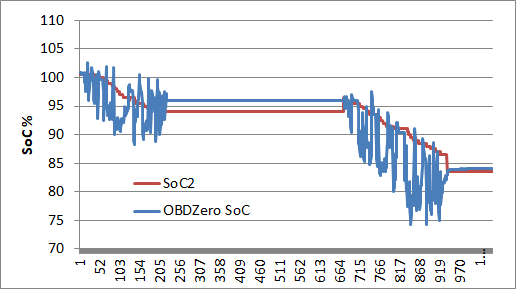
I have analyzed piev's data. piev's Arduino bridge changes only 3 values sent by the BMU. They are SoC1, SoC2 and the 100% battery capacity in Ah (PID 374 byte 6). All other values are past though unchanged. OBDZero receives and records these values independently of the bridge. This graph shows the SoC2 computed and transmitted by the bridge. SoC1 is identical. OBDZero SoC is computed by OBDZero using the voltage and the same algorithm as the bridge program. It is the algorithm we discussed above.

2024-04-03-So-C.png


The noise in OBDZero SoC is due to the changing voltage while the car was moving. When the car was at rest at the end of the data series, SoC2 and OBDZero SoC match. This indicates that piev's program is working as it should. I have also checked the capacity sent by the bridge (PID 374 byte 6). It is constant at 90 Ah. No errors here either.

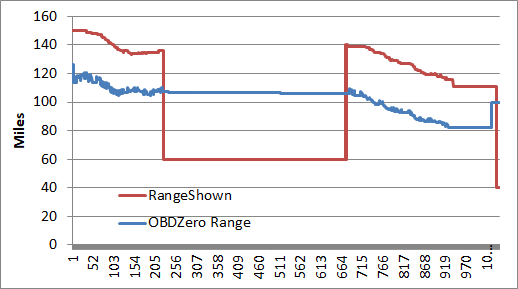
After that I checked the range shown on the dashboard and this agrees somewhat with the OBDZero's estimate of the range.

2024-04-03-Range.png

(The difference between the two ranges probably has to do with different estimates of the Wh/km and different start values for the remaining Ah in the battery.)

Every indication is that piev's range shown is better than OBDZero's estimate. But there are two places where the range shown is too low. While the car wasn't moving from data 256 and data 715 and again after data 1048. The 1048 drop is the one piev observed. It appears that the ECU that computes the range shown has some fall back computation that assumes the old LEV50 capacity. This fall back computation comes after the car has been at rest for some minutes. As soon as the car starts moving again the range corrects itself as shown in the graph.

As far as I can see piev's bridge is working perfectly. This is great progress.
 
Hey David,

After my latest test drive I am wondering why we cut off the SoC volts table at 3.54912?

If volts = 3.053819 then SoC = 0 is this where NMC chemistry = 0? I thought it went to 2.75V.

In addition the car stops at 10% SoC.

So with the equation SoC = 12.096*volts -36.939, when volts meets the condition of < 3.54912 we are at 5.397% SoC.

I don't want to stop the discharge at 3.54912 volts which is what is happening.

In fact, doing the math now.... we go below 10% at 3.61536 Volts in the previous equation.

I think 3.6 volts is well above 10% SoC, am I wrong? I think 3.6 volts is over 50% SoC.

i think we should hit 10% around 3.4 Volts.
 
Back
Top