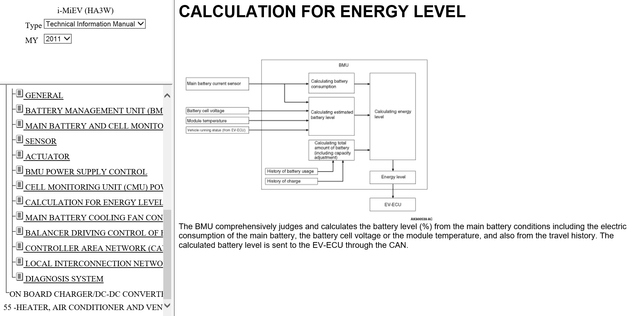
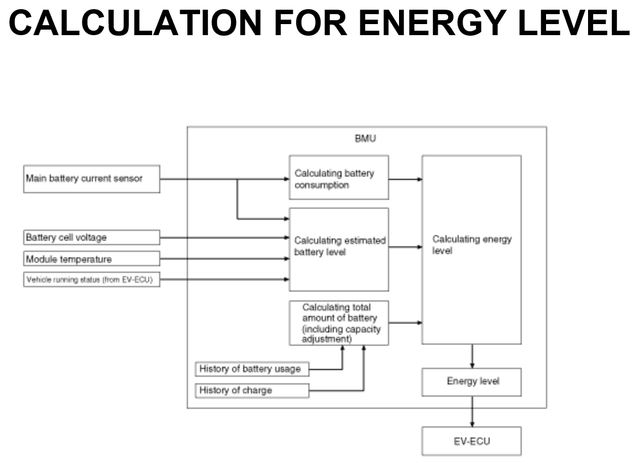
This diagram of the Battery Management Unit (BMU) from the iMiev Technical Information Manuel outlines the iMiev method of measuring the present fully charged capacity (just capacity from now on) of the car’s battery as reported in PID 762. This method also applies to the iOn and CZero cars.
The diagram shows three calculations feeding information to a calculation of the energy level (SoC) in the battery. The manual contains no further information on how these calculations are performed.
The top calculation “Calculating battery consumption” shown in the diagram receives a signal from the main battery current sensor. This system probably keeps an account in ampere-hours (Ah) of the current to and from the battery. This is called coulomb counting.
Capacity is calculated by the bottom calculation named “Calculating total amount of battery” (CTAB). The following is an analysis of this capacity calculation based on data collected by two of us, joloeber and iOnier, both contributors to the German GoingElectric forum. https://www.goingelectric.de/forum/viewforum.php?f=222
It is important to keep in mind, that we are reverse engineering a calculation of battery degradation programmed into the BMU by Mitsubishi engineers prior to the car leaving the factory. We are not calculating the true capacity of the battery.
joloeber iMiev 2011
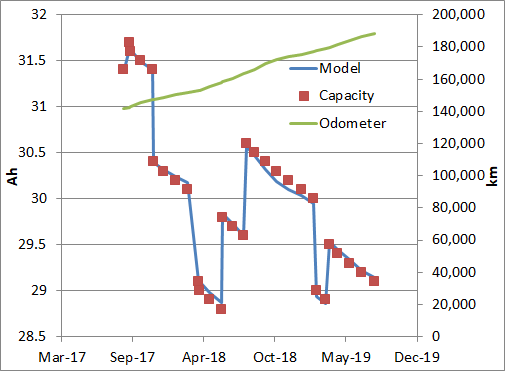
This first graph shows the data record by joloeber from his 2011 iMiev using the CaniOn app. For clarity the capacity is shown as a time series. However the change in the capacity follows the car’s mileage more closely than the age of the car. Therefore, the model shown in the diagram is:
Ah = 48 - 0.0388 * sqrt(km) plus or minus 1 Ah corrections.
Note that this agrees with the input “History of battery usage” to the CTAB shown in the BMU diagram. The correction agrees with the “capacity adjustment” in the CTAB. We believe this capacity adjustment comes from the capacity measurement done while slow charging. This is the “History of charge” input.
The measurement done while slow charging, was described in another post. It requires the SoC to be less than 70% before charging and 100% after charging.
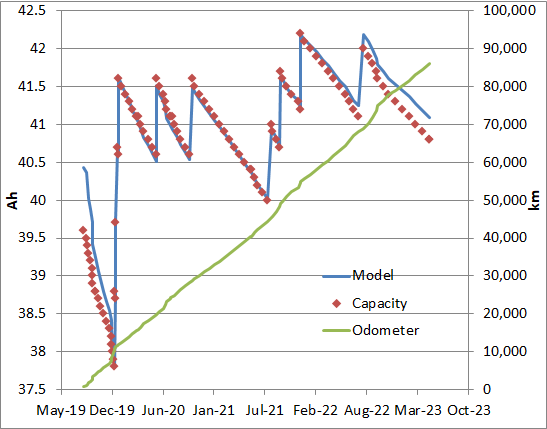
The next graph shows capacity data from joloeber’s second car, a 2015 iMiev. This was also collected using CaniOn.
joloeber iMiev 2015
The model in this case is:
Ah = 48 - 0.0355 * sqrt(km) plus minus 1 Ah corrections
Note that there is poor agreement between the model and the capacity for the first series of data ending in mid-December 2019. This may be due to the long time between the build in 2015 and the first km driven in 2019. This requires further analysis. The factor 0.0355 is similar to the 0.0388 for the 2011 iMiev. Considering the accuracy of the models the factor could be the same for both cars.
Also interesting is the rapid correction of the capacity from 37.8 Ah to 41.5 Ah in the space of one month starting in mid-December. This occurred in 1 Ah steps, the largest correction permitted by the BMU calculation.
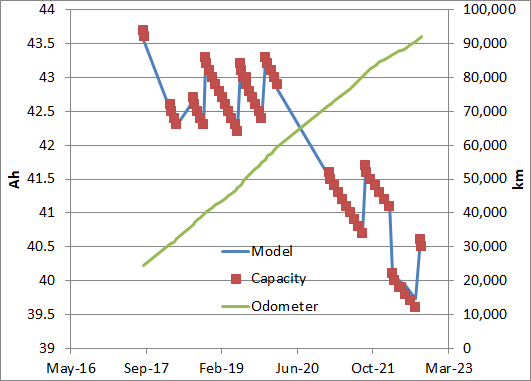
iOnier iOn 2015
This last data set is from iOnier’s 2015 iOn collected using CaniOn. The model is:
Ah = 48 - 0.054 * sqrt(km) plus minus 1 Ah corrections
In this model the factor 0.054 is significantly larger than the factors for joloeber’s cars. The difference is probably due to the difference between the km driven per day. IOnier drives an average of 38 km/d while joloeber drove 68 km/d in his 2011 car and drives 61 km/d in his 2015 car. (Datom, in his analysis of the data on the German GoingElectric forum, included km/d as a factor.) IOnier’s factor is larger because the BMU also takes time and aging into account when computing the capacity. In other words there are more days per km for iOnier’s car than joloeber’s and the factor in this model for iOnier’s car must be larger to account for this.
This means that the correct model should include both the age of the car and the number of km driven. We have not found this model yet. More data from cars with different km per day would help.
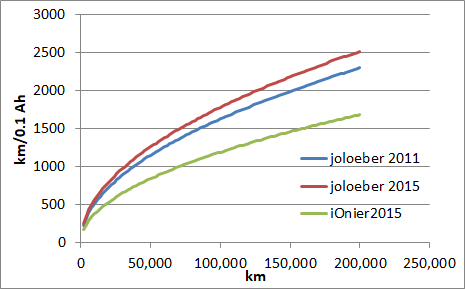
This graph shows the average number of km between 0.1 Ah downward steps of the capacity computed by the BMU. This graph was computed using the models show above.
The graph shows that iOnier’s iOn loses 0.1 Ah after fewer km than joloeber’s iMiev because it takes iOnier longer to drive those km. Again time plays a role in the BMU capacity calculation as well as km driven. It also shows that the Mitsubishi engineers that designed the system expected the rate of degradation to slow as the battery aged.
These observations have some interesting consequences. Of these the most important is that the battery capacity deterioration is in fact much slower than the Mitsubishi engineers expected at least for iMiev/iOn/CZeros in Germany. This is indicated by the frequent 1 Ah upward corrections in the capacity shown in the graphs above. The reason for this may be that the engineers had to account for cars operating at higher temperatures than the average in Germany.
Another important consequence can be seen in the data from joloeber’s iMiev 2015. This car spent almost 3 years from its build date to its first use. During that time it may not have been charged properly such that the BMU could measure the capacity. However the BMU deterioration model was running all the time, steadily reducing the BMU’s capacity estimate. As soon as joloeber began charging the car normally the BMU was able to correct its very low capacity estimate to a much more reasonable value.
In conclusion it is necessary for the BMU calculation of the battery capacity that the car be slow-charged from less than 70% SoC to 100% on a regular basis. This insures that the BMU measures the capacity and can make the necessary adjustments to its preprogrammed capacity estimate. If the measurement isn’t performed because e.g. the car isn’t charged to 100% or the car is only charged via the Chademo port, the BMU capacity will slowly and regularly decrease until it is well below the true capacity of the battery.
joloeber, iOnier and CZeroOwner
