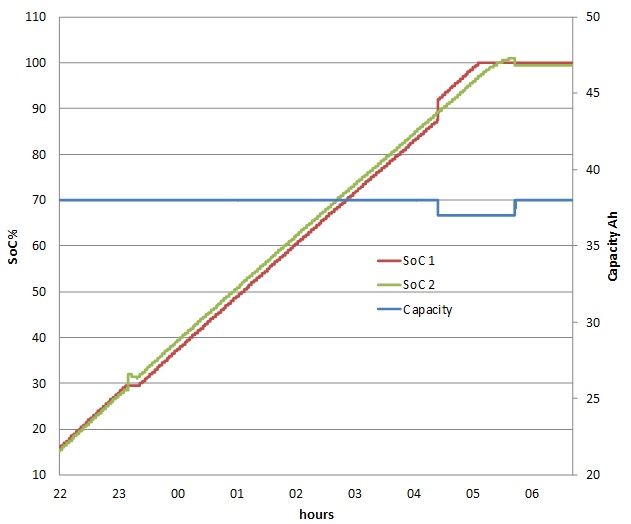
Some days ago I recorded the data shown in the graph above. SoC 1 the red line is the state of charge we normally use. It is the first byte in the 374 PID. SoC 2, the green line, is the second byte in the 374 PID. Capacity, the blue line is the car’s estimate of the present fully charged battery capacity in Ah. It is byte 7 in the 374 PID. The interesting thing is the two changes in the capacity, first a drop from 38 to 37 Ah then the increase from 37 back to 38 Ah. The first change coincides with an increase in SoC 1 from 87.5% to 92%, the second with a decrease in SoC 2 from 101% to 99.5 %. This could be noise however I checked other recordings and found 5 more changes in the estimated capacity, all 6 of these recorded changes including the first change shown above occurred while SoC 2 was 89% and the car was charging. The second change in capacity shown above occurred when SoC 2 was 101%. This is my only observation of this type of change in capacity
Both SoC 1 and 2 appear to be based on the estimated capacity and a running account of Ah to the battery. I think that there are two estimates of capacity one for SoC 1 and another for SoC 2. The capacity shown is an average of the two. When SoC 2 is 89% the car adjusts the SoC 1 estimate in order to bring the two estimates closer to each other. That’s why SoC 1 changes at the same time as the change in the shown capacity. In the case above the change is too large with the result that SoC 1 “overshoots” SoC 2. This may be because the car uses only 2 digits for the SoC 1 and SoC 2 capacities. The second change in the capacity shown in the graph is a result of a change in the SoC 2 capacity, because SoC 2 changes rather than SoC 1. This change brings SoC 2 down to less than 100%.
I’ve observed two other situations in which the SoC 2 capacity estimate appears to change. One of these can be seen in the graph when SoC 2 is 28.5 %. I found a second observation of a large change in SoC 2 also at SoC 2 equal to 28.5 % and charging and possibly a third at 28.5 % but this time while discharging. The shown capacity didn’t change in these three cases. The second situation I observed occurred when SoC 2 was 70%. I found 5 observations of this type, all while charging and again with no change in the shown capacity.
It appears that the SoC 2 capacity estimate is adjusted when the SoC 2 is 28.5 %, 70 % and 101 %. The SoC 1 capacity estimate is only adjusted when SoC 2 is 89%. The shown capacity is adjusted when SoC 2 is 89% and 101%. What isn’t obvious is how the SoC 2 capacity is adjusted at 28.5% and 70%. These adjustments may be based on the battery voltage.


