Malm, thanks for posting this. Interesting that it hung in there at 361v for a while - how well balanced is your pack now? BTW, did you do this with a camera or somehow did a periodic screensave? If with a camera, then maybe next time use the camera's timestamp if it has that feature? I wonder if a similar run showing battery voltages would pinpoint any questionable cell(s)?
You are using an out of date browser. It may not display this or other websites correctly.
You should upgrade or use an alternative browser.
You should upgrade or use an alternative browser.
Canion Battery Readings
- Thread starter DonDakin
- Start date
Help Support Mitsubishi i-MiEV Forum:
This site may earn a commission from merchant affiliate
links, including eBay, Amazon, and others.
Malm
Well-known member
Periodic screenshot. 20-30s between. Well balanced, they are well balanced. Only when the total voltage is bellow 325V became unbalanced. This only happens at a low SoC, 10-15%. The problem is that my car sometimes think that has 25% of SoC when the SoC is only 10-15%. Maybe a sign of 10%-15% degradation. Temperatures outside where 14º C. In the end, some sensors show 25º C, scary to me. Day by day 25º C will be a normal temperature :? . Beatiful and scary, could be the name of the video.
Minute 2:09 - The 70% pause :roll:
Minute 2:44 - :shock: , never seen before, the SoC goes instantly from 82,5% to 90,5%. The car thought that had less SoC then it actually had, and recognizes it in that moment. Another sign of the 10-15% degradation?
My car has this particulary feature now, 96% is 100% :roll: . With some of my tricks (malmonastic magic), I can transform that 96 number in 100%. Easy. Easy to full everybody and saying it has zero degradation. Allways 16 bars, can charge to 100% and 361 V and can stop in turtle (less then 10% of SoC and 300 V). But for that, I will have to perform some tricks that anyone knows and understand. I like to call this magic, as you already know.
Even with what it takes from the wall is possible to full all world. Just heat the pack driving fast to 40º C and it will take more energy from the wall that time, while charging.
Malm
Well-known member
Watching my video http://www.youtube.com/watch?v=RkB2TG-gsvU , I think its possible to identify two lines across the pack that are hotter, both under our feet :roll: .
https://www.dropbox.com/s/lcb6eqquotf6zfj/hotlines.jpg
Anyone knows the reason why?
https://www.dropbox.com/s/lcb6eqquotf6zfj/hotlines.jpg
Anyone knows the reason why?
RobertC
Well-known member
Temperature Sensor #64 high readings during charging.
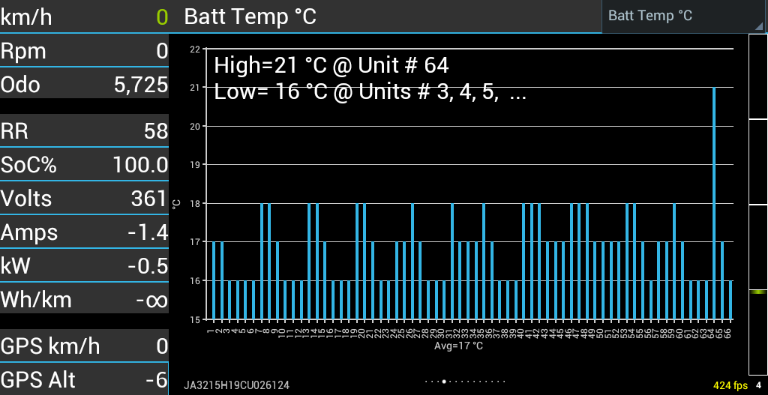
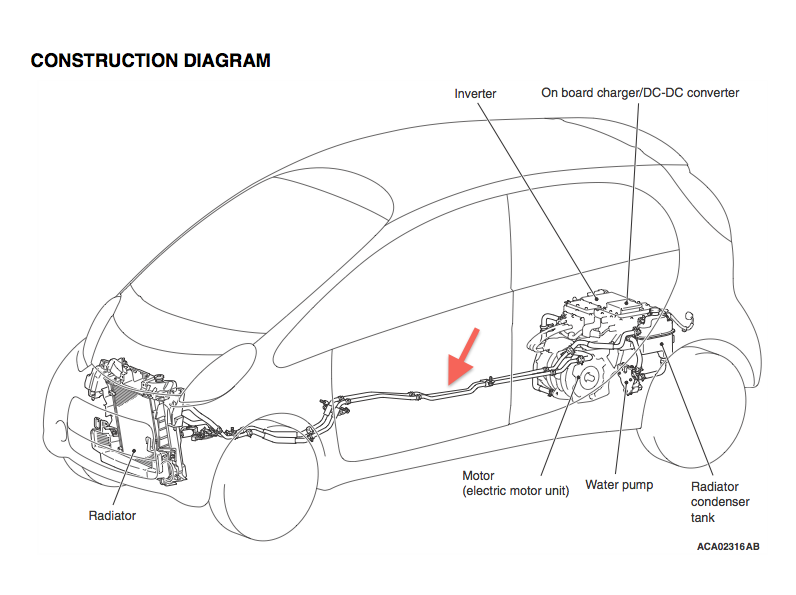
Temperature Sensor 64 is high during charging due to its proximity to the radiator hose that gets hot with circulating coolant during charging. The cooling system is dissipating heat from the charger. I hear the water pump run often during charging.
siai47 said:I also have the temperature anomaly at sensor #64. I don't know what causes it but it is apparent during charging, not operation. When the car has been sitting (not on charge) all 66 sensors read the exact same temperature.
I believe that Malm is correct.Malm said:I have no doubt what makes 64 heating. That´s the tube of the charger refrigeration that gets very close to the battery box, in a point very near the 64.
Temperature Sensor 64 is high during charging due to its proximity to the radiator hose that gets hot with circulating coolant during charging. The cooling system is dissipating heat from the charger. I hear the water pump run often during charging.
Malm
Well-known member
Yes. The tubes get very close to the battery box, but specially in that point close to the sensor 64. All along the car, on the top of the box, there are these two tubes, but only in particular points they are very, very close to the upper part of the battery box, and one is near the 64 sensor. So, cells 85, 86 should suffer a little more from the heat then the others, and never will be the ones in better shape.
I have other cells that are more affected then 85 and 86, like the 64. That's the price to pay for being an internal cell in a car that can have more then 40º C in their batteries.
I have other cells that are more affected then 85 and 86, like the 64. That's the price to pay for being an internal cell in a car that can have more then 40º C in their batteries.
If the coolant tubes running close to the last battery module is causing a rise in temperature in the sensors, it should be reflected in more then one sensor. The battery module that should have sensor #64 in it should be the last module in the string. This is a four cell module that runs parallel to the coolant tube which means that all the sensors within the module should be running hotter then the rest. In fact #64 runs hot in my car when I am using an external charger and providing cooling air into the pack. Something else must be going on. In regards to moving cells around, that would be a real difficult problem as the modules are a bear to disassemble. I am not even sure the modules themselves can be moved around in the pack let alone the individual cells. I don't know if the CMS (cell monitoring system) address the modules by were they are located in the wiring harness or by coding the module itself with the ID information. I do know this. When you look at the airflow distribution in the pack (when supplying A/C to cool it, the bulk of the air is distributed into the area between the front and rear sets of modules with the lowest airflow reaching the five modules in the rear of the pack. The air enters the front right corner of the pack and goes into a distribution tube that directs it to the center and the left front of the pack. The air exhausts through the top cover over the rear modules. This uneven distribution shows up on the CANION temperature display after cooling.
Malm
Well-known member
siai47 said:If the coolant tubes running close to the last battery module is causing a rise in temperature in the sensors, it should be reflected in more then one sensor. The battery module that should have sensor #64 in it should be the last module in the string. This is a four cell module that runs parallel to the coolant tube which means that all the sensors within the module should be running hotter then the rest. In fact #64 runs hot in my car when I am using an external charger and providing cooling air into the pack. Something else must be going on. In regards to moving cells around, that would be a real difficult problem as the modules are a bear to disassemble. I am not even sure the modules themselves can be moved around in the pack let alone the individual cells. I don't know if the CMS (cell monitoring system) address the modules by were they are located in the wiring harness or by coding the module itself with the ID information. I do know this. When you look at the airflow distribution in the pack (when supplying A/C to cool it, the bulk of the air is distributed into the area between the front and rear sets of modules with the lowest airflow reaching the five modules in the rear of the pack. The air enters the front right corner of the pack and goes into a distribution tube that directs it to the center and the left front of the pack. The air exhausts through the top cover over the rear modules. This uneven distribution shows up on the CANION temperature display after cooling.
Siai47, you don't agree with my distribution of modules and sensores? https://www.dropbox.com/s/mlswv2z6z5uo907/Ultimate%20Malm.jpg
I agree with your distribution charts. I am just saying that the physical location of the final battery in the I-MiEV pack puts the battery with the #64 sensor inline with the coolant tubes. Therefore, more then one sensor should be impacted. Your chart is correct IMO, however the entire module is actually sitting under the coolant tube(s) which should heat more then #64. In some of my old posts is this link to photos of the pack. Not a real good shot of the module in question but you will see what I mean. http://imgur.com/a/Dug92
Malm
Well-known member
"the entire module is actually sitting under the coolant tube(s) which should heat more then #64" - I agree, but the coolant tubes are not always at the same distance. Maybe in one place the tubes get so much close to the pack that one sensor can detect it. I understand what you are saying, you are saying that numbers 57, 56, 55, 54, 53 should detect that heat. What I say is that the tubes go in fact over the 57, 56, 55, 54, 53, but not close enough to warm them. But over the 64, then the tube gets so close to the box battery, that can maybe even touch it, and the 64 sensor feels that heat. That's my theory, but you can be right, maybe there is other thing.
BlueLightning
Well-known member
Battery Internal Resistance Measure
With more than 50 A of variations in one second, the decrease of voltage because of the battery discharge can be neglected.
The ratio (Volt 1–Volt 2) / (A 1-A 2) of the voltage drop or increase on the amperage variation during one second give the battery internal resistance.
My 16 kWh battery have 88 Cells, the battery internal resistance wich is around 0.1 Ohm is divided by 88 and multiply by 1000 to give an average Cell resistance R around 1.25 milli Ohm.
This test is usually done when my electric car is mistaken for a golf car.
By the way, strong acceleration shouldn’t be done at low State of Charge because as you will see, the voltage could decrease up to 20 Volt when the battery is cold and too much low voltage could jeopardise some battery cells.
This protocol could be followed by Martin & Xavier to measure the battery internal resistance.
This value divided by the number of cells would give an average battery cell internal resistance at a given temperature.
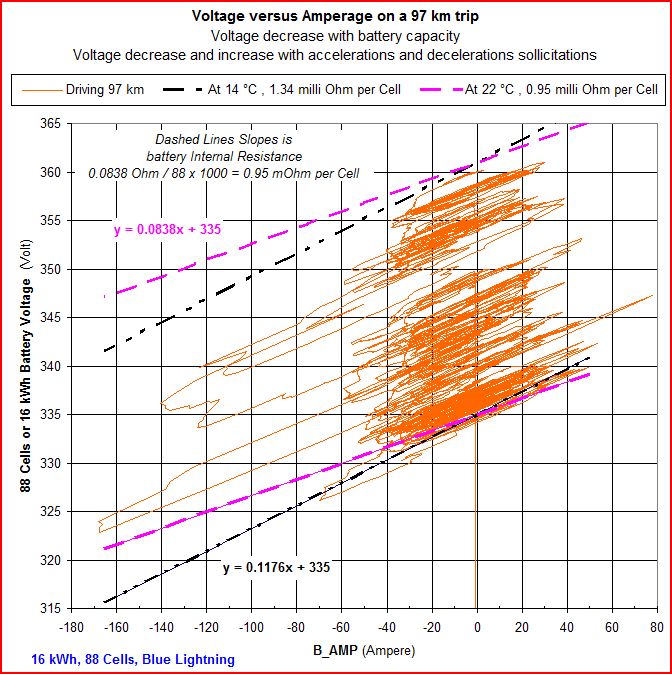
Voltage versus Amperage driving
Canion Cell Internal Resistance measurment
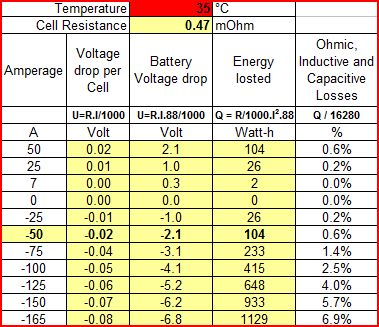
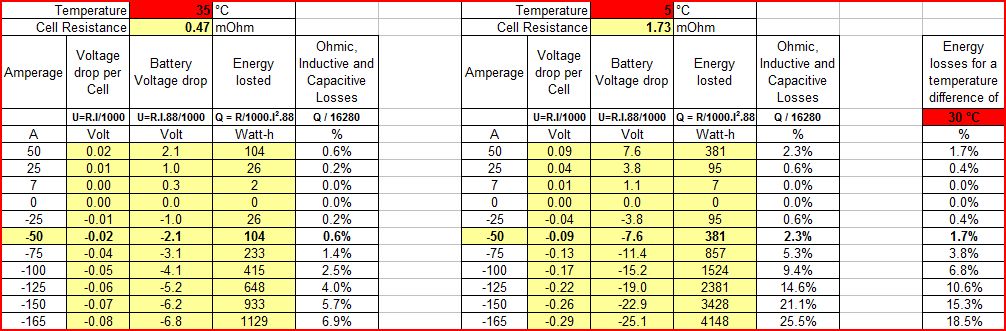
35°C Battery Cell Internal Resistance effects
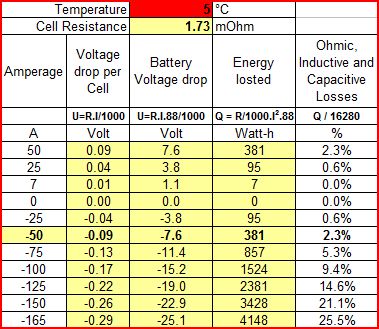
5°C Battery Cell Internal Resistance effects
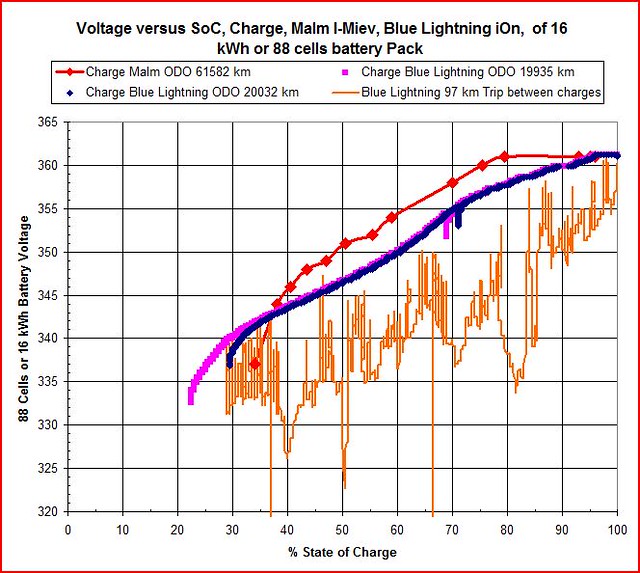
Battery Volt versus SoC with Malm
With the help of SecLog database from CaniOn, when the amperage variation is more than 50 Ampere in one second in a positive or negative way, I do the math to get the battery internal resistance.FiddlerJohn said:You battery's internal resistance is a good indicator of health. Full acceleration should draw 150 Amps and the pack voltage should drop around 15 Volts. That gives a battery internal resistance of 0.1 Ohms.
I measured a 10,000 mileage pack with a 14 volt drop, but my 23,300 mile pack has a 17 volt drop. I try to measure the Voltage drop with a 50% to 80% SOC.
With more than 50 A of variations in one second, the decrease of voltage because of the battery discharge can be neglected.
The ratio (Volt 1–Volt 2) / (A 1-A 2) of the voltage drop or increase on the amperage variation during one second give the battery internal resistance.
My 16 kWh battery have 88 Cells, the battery internal resistance wich is around 0.1 Ohm is divided by 88 and multiply by 1000 to give an average Cell resistance R around 1.25 milli Ohm.
This test is usually done when my electric car is mistaken for a golf car.
By the way, strong acceleration shouldn’t be done at low State of Charge because as you will see, the voltage could decrease up to 20 Volt when the battery is cold and too much low voltage could jeopardise some battery cells.
This protocol could be followed by Martin & Xavier to measure the battery internal resistance.
This value divided by the number of cells would give an average battery cell internal resistance at a given temperature.
Voltage versus Amperage driving
Canion Cell Internal Resistance measurment
35°C Battery Cell Internal Resistance effects
5°C Battery Cell Internal Resistance effects
Battery Volt versus SoC with Malm
Hello!
Wow, very impressive introduction and visualisation!
So, the internal resistance is a good indicator for battery health and/or battery age. The calc should be done at high amps for precision?
How to interpret the chart of charging Malm's vs. your car? I see a significant drop at 37% SoC. So one ore more cells reached their capacity limit? On the other side end-of-charge-voltage is reached already at 80%. The same thing? One or more cells reached their capacity limit?
Martin
Malm
Well-known member
For me, two things explain the diference:
- My car considered that it had, as new, 5% more capacity then the Blue Lightning (but was wrong it had exactly the same capacity) (that's why I could do 175 km mRR, what is not usual). This makes it not getting the SoC correctly, that´s why in the video we see a jump in SoC in the final stages;
- My car had something like 12 to 14% battery degradation, so it couldn't charge the same amount of energy as the LB. But it thought it could, and 5% more. But it no longer couldn't.
BlueLightning
Well-known member
I am not sure internal resistance is a good indicator, see http://batteryuniversity.com/learn/article/how_to_measure_internal_resistance "Figure 1: Relationship between capacity and resistance as part of cycling Resistance does not reveal the state-of-health of a battery.me68 said:Hello!
So, the internal resistance is a good indicator for battery health and/or battery age. The calc should be done at high amps for precision?
How to interpret the chart of charging Malm's vs. your car? I see a significant drop at 37% SoC. So one ore more cells reached their capacity limit? On the other side end-of-charge-voltage is reached already at 80%. The same thing? One or more cells reached their capacity limit?
Martin
The internal resistance often stays flat with use and aging."
No comparison should be done at low SoC, voltage always rise sharply at the beginning of a charge to reach quickly the curve of a charge at a lower SoC.
There is a difference just because I started a charge at a lower SoC
After the SoC increase, most of my recharge curves follow the same path, but recharge is done in a garage with a temperature which is nearly always the same, here are probably the tricks of Malm who recharge at low or high temperature, I also always do a full charge.
Yes, the calc should be done at high amps variations for precision and a short time too, more than 50A variation per second seems to avoid the artefact with battery discharge.
I got some too big and incomplete data from Prius Fan, no Cell_temps with temperatures, no charge data in SecLog, the maximum number of line is of 65536 in an excel sheet, the driver have a real heavy foot, when I get hardly one measure of internal battery resistance, there is dozen of measures from 0.5 milli Ohm to 1.0 milli Ohm per cell from the 6th of june to 17th of june 2013 if this car have a 88 Cells Battery. Average Internal Cell resistances which are much smaller than mine....
Malm
Well-known member
"No comparison should be done at low SoC, voltage always rise sharply at the beginning of a charge to reach quickly the curve of a charge at a lower SoC.
There is a difference just because I started a charge at a lower SoC" - I agree
There is a difference just because I started a charge at a lower SoC" - I agree
BlueLightning
Well-known member
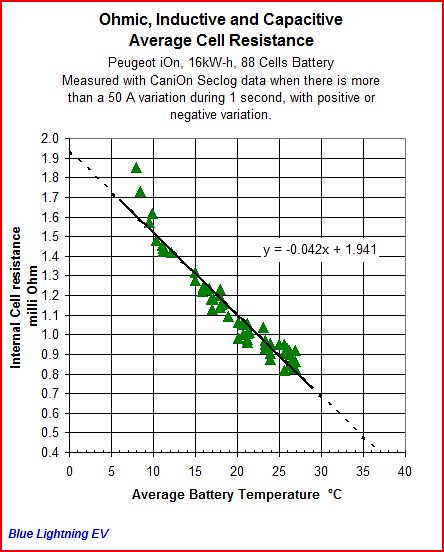
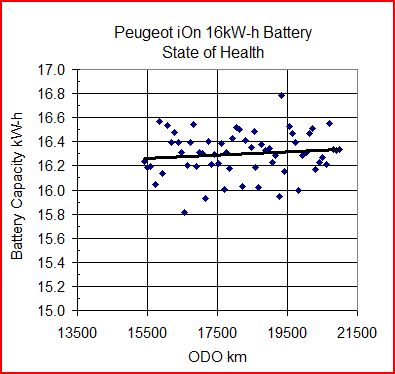
Update of average internal battery Cell Resistance versus temperature. This is a Peugeot iOn 16 kWh battery with 88 Cells, clone of the i-miev.
Last February didn't give me much data at low temperature, at the lowest temperatures, the internal resistance measurement is done at deep deceleration (regeneration).
Other points are a mixture of measurement at acceleration and deceleration.
Moderate summer temperatures over here will not help for more measures at higher temperature.

Canion Cell Internal Resistance measurment
Internal Battery Resistance energy losses
This Internal Battery Resistance subject is over for me.
Any volonteers to test Blue Lightning EV SoH formula............ Battery total capacity = 60 / 50 x "Wh reg" x 100 / (100 - "SoC% initial")
"Wh reg" .......: from CaniOn "Trip Timer", value in kWh after a full Recharge
"SoC% initial" : State of Charge before full Recharge on CaniOn "Trip Timer"
"Reset" before charge
Full Battery capacity Measurement
Last February didn't give me much data at low temperature, at the lowest temperatures, the internal resistance measurement is done at deep deceleration (regeneration).
Other points are a mixture of measurement at acceleration and deceleration.
Moderate summer temperatures over here will not help for more measures at higher temperature.
Canion Cell Internal Resistance measurment
Internal Battery Resistance energy losses
This Internal Battery Resistance subject is over for me.
Any volonteers to test Blue Lightning EV SoH formula............ Battery total capacity = 60 / 50 x "Wh reg" x 100 / (100 - "SoC% initial")
"Wh reg" .......: from CaniOn "Trip Timer", value in kWh after a full Recharge
"SoC% initial" : State of Charge before full Recharge on CaniOn "Trip Timer"
"Reset" before charge
Full Battery capacity Measurement
Malm
Well-known member
Data from my last 105 km trip. This time, the car was able to get SoC correctly. It behaves like a 13,3 kWh i-MiEV. With that voltage at 20% SoC, I'm sure it was going to stop only at 0,0% SoC.
https://www.dropbox.com/s/lcgm7ssprvbjhh2/Malm.docx
https://www.dropbox.com/s/lcgm7ssprvbjhh2/Malm.docx
Malm
Well-known member
Blue Lightning EV SoH formula............ Battery total capacity = 60 / 50 x "Wh reg" x 100 / (100 - "SoC% initial")
That formula don't work with mine. 60/50 x 10.188= 12,2 kWh . In my last trip I could use 13,3 kWh, so it's not working with mine. But is possible to work with most of i-MiEV (because I have one of the fews that recalibrate it's capacity.
That formula don't work with mine. 60/50 x 10.188= 12,2 kWh . In my last trip I could use 13,3 kWh, so it's not working with mine. But is possible to work with most of i-MiEV (because I have one of the fews that recalibrate it's capacity.
BlueLightning
Well-known member
Thanks Malm for your help, but knowing your SoC before your full charge is crucial, let say a initial SoC before charge of 25 %Malm said:Blue Lightning EV SoH formula............ Battery total capacity = 60 / 50 x "Wh reg" x 100 / (100 - "SoC% initial")
That formula don't work with mine. 60/50 x 10.188= 12,2 kWh . In my last trip I could use 13,3 kWh, so it's not working with mine. But is possible to work with most of i-MiEV (because I have one of the fews that recalibrate it's capacity.
Then 60/50 x 10.188 x 100 / (100 - 25 ) = 60/50 x 10.188 x 100 / 75 = 16.30 kWh
Or let imagine your battery is now 14.2 kw-h because of a 13% lost of capacity then SoC before charge was 14%
Then 60/50 x 10.188 x 100 / (100 - 14 ) = 14.2 kWh
Or if your SoC was of 0% then as you say 60/50 x 10.188 x 100 / (100 - 0 ) = 12.2 kW-h
Malm
Well-known member
10,188 from 0,0% to 100%, so, by your formula, remaining capacity is 12,2 KWh (12,2/16 = 76% of original capacity).
Don't match with any of my results:
Battery remaining capacity 36,4 Ah - 36,4 Ah / 50 Ah - 73% of original capacity
What I can charge from the wall 16 kWh - 16 kWh / 18,5 kWh - 86,4% of original capacity
What I can discharge from the battery, as seen by canion - 13,3 / 16 = 83,1% of original capacity
Sorry, but with me, that formula doesn't work. It can't be of 12,2 kWh.
BlueLightning
Well-known member
Well let test another formula this one from the wall with 16A Charger
Battery Capacity =("Wall kWh"-0.1925)/1.213/(100-SoCinitial)*100
Wall kWh = 16 kWh, SoC = 0 %, then wall formula give a Battery capacity = 13.3 kWh
Wall kWh = 18.8 kWh, SoC = 0 %, then wall formula give a Battery capacity = 15.1 kWh
Blue lightning EV Wall kWh = 16.8 kWh, SoC = 16.5 %, then wall formula give a Battery capacity = 16.4 kWh
http://www.empa.ch/plugin/template/empa/*/135716 page 4 on top right is the linear regression formula
I didn't give this one first, because it might be related with the Charger "10A" or "16A"
Thanks for your help Malm, will be back in one week
Similar threads
- Replies
- 7
- Views
- 1K
- Replies
- 8
- Views
- 1K
- Replies
- 3
- Views
- 814