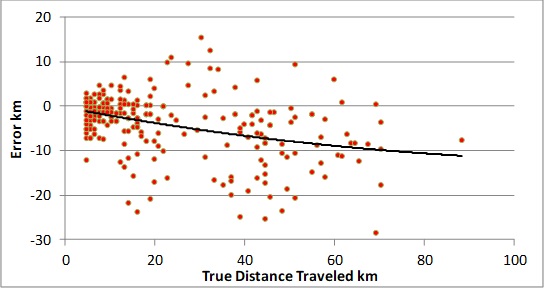
This graph shows the error in the rest or remaining range (RR) predicted by the car. Each dot is a "trip" consisting of continuous data. I found them by dividing my recorded data into trips in which the largest change in the odometer (odo) or the RR was 1 km. This means that larger changes such as turning on or off the heater or the AC marked a new trip. If data collection stopped this was marked as the end of a trip. This resulted in about 300 trips. For each trip I subtracted the start odo from the end odo to get the number of km driven. To get the true number of km driven I reduced the odo km driven by 5% based on experience. Then, I removed all trips less than 5 km because I figured that they were of no interest. 240 trips remained.
After that I subtracted the end RR from the start RR to get the number RR km used for each trip. Finally I subtracted the RR used from the true km driven to find the error. This means that if the km driven were greater than the RR km used the error is positive. As you can see the reverse is more often true. I used more RR km than the true km driven. For the longest trips the average error was about -10 km.
The next graph shows the error as a function of the average speed for each trip.

As expected I ate up the RR at high speed.
This is a graph of the error as a function of the predicted RR at the start of each trip.
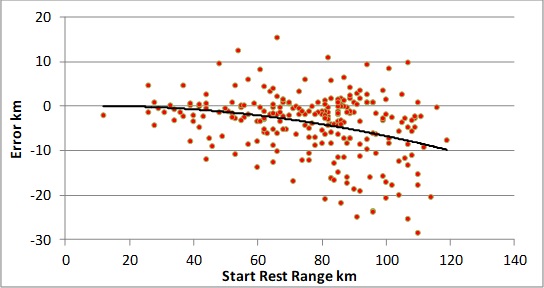
The reassuring thing here is that as the RR gets smaller both the accuracy and the precision of the prediction improves. So if there is only a 10 km left in the battery and you are worried about making it home the RR is more dependable.
The impression I got form the graphs above is that the error is large but actually it isn’t as bad as it looks.
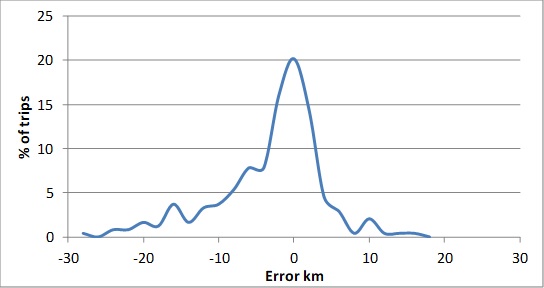
This graph shows the distribution of the errors. The most frequent difference between RR km used and true driven km is in fact 0. 20% of the time there is practically no error. About half the errors are between -5 and +5 km and 2/3 of the errors are between -10 and +10 km.
")