You are using an out of date browser. It may not display this or other websites correctly.
You should upgrade or use an alternative browser.
You should upgrade or use an alternative browser.
Battery Capacity Testing
- Thread starter tinoale
- Start date
Help Support Mitsubishi i-MiEV Forum:
This site may earn a commission from merchant affiliate
links, including eBay, Amazon, and others.
DBMandrake said:Canion, Hobdrive, and Evbatmon will all give the HV battery Ah capacity.
Canion is free but requires a more expensive STN11xx adaptor (such as OBDLink LX) and will not work with a cheap ELM327 adaptor.
Hobdrive has a free version and will work with a cheap ELM327 adaptor so is probably the cheapest outlay to read the battery capacity if you already have an Android device.
hi Simon,
Thought to give Hobdrive a try, as my Canion Trip screen has been blank for a while. At the first run, Hobdrive asks for make/model, which list Mitsu and not iMiev. What model do you select ? or perhaps I downloaded the incorrect apps.
For some reason, my Canion screen where the real-time Ah was display. It still shows Ah history, but roughly on a monthly interval.
Thanks for any hints.
DBMandrake
Well-known member
Hobdrive is not the easiest to use. To initially set it up, go to Screens->Settings, under OBD-II port settings to select your (already paired) bluetooth OBD adaptor.pbui19 said:DBMandrake said:Canion, Hobdrive, and Evbatmon will all give the HV battery Ah capacity.
Canion is free but requires a more expensive STN11xx adaptor (such as OBDLink LX) and will not work with a cheap ELM327 adaptor.
Hobdrive has a free version and will work with a cheap ELM327 adaptor so is probably the cheapest outlay to read the battery capacity if you already have an Android device.
hi Simon,
Thought to give Hobdrive a try, as my Canion Trip screen has been blank for a while. At the first run, Hobdrive asks for make/model, which list Mitsu and not iMiev. What model do you select ? or perhaps I downloaded the incorrect apps.
For some reason, my Canion screen where the real-time Ah was display. It still shows Ah history, but roughly on a monthly interval.
Thanks for any hints.
Then go to Screens->Settings->Vehicle settings go to ECU Settings then on the right choose Mitsubishi iMiev Li-ION. Don't worry about trying to fill in the My Vehicle section - there isn't any valid choice that matches these cars.
That should get the device to connect to the car. (Remember the car needs to be on) If successfully connected the red dot in the lower left will go green.
To get the usable Ah capacity go to Screens->BMU, and the figure you're after is BMU_BatteryCurrentCapacity, which will be in Ah. This figure should match that reported by Canion. (It does for me anyway!)
Thank you for your instruction, I was able to get Hobdrive to work; and indeed the Ah is same value as from Canion. I did get the dreaded warning light car-with-!; but it went away upon restart.
I am glad to see the 12v-aux voltage display, is there a way to plot this voltage ? my thinking is the plot may show a voltage drag upon starting/relay engaging etc... which would indicate a weak 12-v batt.
My indicated Ah value has been dropping quite a bit these last few months; but I am not sure that my range has been affected. Have to wait for warmer weather for the reference drive.
Has anyone notice the Ah value increasing after a calibration-charge ?
-Paul
Hi Paul, yes mine went from 38.1Ah to 39.1Ah a couple of months ago after I did a long slow charge from two bars. Presently sitting at 38.9Ah. This was on the replacement battery which has about 35K miles on it. Even though I pamper my battery when charging, I'm afraid my leadfoot is not nice to it otherwise.pbui19 said:...Has anyone notice the Ah value increasing after a calibration-charge ?
DBMandrake
Well-known member
The warning light was probably caused by connecting Hobdrive to the car before you selected the ECU type. It defaults to normal OBD-II scanning using multiple protocols - this upsets these cars and sets fault codes and lights the warning light. Other apps like Torque Pro etc will cause the same issue, in fact any generic OBD-II application that is not specifically compatible with these cars.pbui19 said:Thank you for your instruction, I was able to get Hobdrive to work; and indeed the Ah is same value as from Canion. I did get the dreaded warning light car-with-!; but it went away upon restart.
The warning light will self reset after a power cycle and most of the fault codes will clear by themselves so its not something to worry about. Once the correct ECU is selected it won't happen again.
I don't think you can graph the voltage, at least not at a high sample rate that would show what you're looking for. You can get the 12 volt battery reading either from the EV ECU - which I'm guessing is what you're looking at, or from the actual OBD-II adaptor itself as the ELM327 protocol allows for asking the OBD adaptor itself to measure the voltage at the diagnostic socket. You can see that in the custom PID's page.I am glad to see the 12v-aux voltage display, is there a way to plot this voltage ? my thinking is the plot may show a voltage drag upon starting/relay engaging etc... which would indicate a weak 12-v batt.
Not sure what you mean by a "calibration charge ?"My indicated Ah value has been dropping quite a bit these last few months; but I am not sure that my range has been affected. Have to wait for warmer weather for the reference drive.
Has anyone notice the Ah value increasing after a calibration-charge ?
I've had a number of large drops in Ah capacity over the last year, documented in the following thread:
http://myimiev.com/forum/viewtopic.php?f=23&t=4014
Due to these large drops my car has gone down from 39.9Ah at 28k miles to only 35.1Ah at 51k miles.

By "calibration charge", I meant to charge from the blinking 1-2 bars to 100%. My understanding is that when the guessometer hits 2 and below bars, the BMS goes into some sort of integration mode to reset the available Ah. In fact, I don't understand how does the software calculates and reports the pack Ah without a calibration charge.
I would say in general, the pack capacity is the input Ah between the SOC when ONE cell reaches the bottom, 2.9 v ?, and ONE exceed the top at 4.10xx ? essential in between the high/low knee voltage curve.
Both Canion & Hobdrive are reported my pack at 36.9 Ah at 22Kmiles; but I can't honestly tell whether my range has diminished. It's the range that matters, not the reported Ah.
DBMandrake
Well-known member
Yes, only a near full discharge from full or charge to full from nearly discharged gives the BMS the opportunity to measure the Ah capacity properly.pbui19 said:By "calibration charge", I meant to charge from the blinking 1-2 bars to 100%. My understanding is that when the guessometer hits 2 and below bars, the BMS goes into some sort of integration mode to reset the available Ah. In fact, I don't understand how does the software calculates and reports the pack Ah without a calibration charge.
In between those few times when it can measure it it simply follows a programmed in "assumed degradation" model. If you have a look at my Ah graph You can see the shallow gradient of about 0.1Ah per 1000 miles is the programmed in degradation model. Periodically the larger drops are based on actual measurements so it can be seen that for my car the actual degradation over the full time I've owned the car is at a much greater rate than assumed by the model in the BMS...about a 3x steeper drop. (in other words Mitsi underestimated the battery degradation)
Yes, although fully discharged (0% SoC reported in Canion and the car shutting down) is 3.63 volts per cell on my car. There is some evidence that as the batteries degrade and lose capacity, a little bit of capacity at the bottom end is "unlocked" by allowing the cells to discharge lower than 3.63 volts. But not too much lower.I would say in general, the pack capacity is the input Ah between the SOC when ONE cell reaches the bottom, 2.9 v ?, and ONE exceed the top at 4.10xx ? essential in between the high/low knee voltage curve.
Mine was at 39.9Ah at 28k miles which at the time was good and seemed better than most other Ion's however after a series of large drops in reported capacity I'd say that mine is now significantly worse than most. I definitely have at least 2 weak cells that are probably responsible for most of the drop and have toyed with the idea of replacing them, however sourcing known-good second hand cells at an affordable price, and having the where with all to replace them (requiring a full day with access to a 2 post hoist) is not easy, so I'm not sure whether it's worth the trouble.Both Canion & Hobdrive are reported my pack at 36.9 Ah at 22Kmiles; but I can't honestly tell whether my range has diminished. It's the range that matters, not the reported Ah.
I've definitely lost range on mine - summer range has gone down from about 63 miles to 55 miles in the 2 years I've had the car, and who knows what the next 2 years have in store for me. As I can barely make my daily commute in the winter as it is now, the next two winters will be tough. I have a rapid charger to fall back on but that adds significant time and cost to the journey home.
hope the photo link can be viewed. It's the Canion Ah history screen of my 2014 since Dec 2018. I've been QCDC charging almost exclusively (to around 80% SOC) , trying to save the onboard charger. The Ah decline line worried me a bit, but it seems to correlate more less Mandrake degradation modeled 0.1Ah/1000-mile; though mine seems a bit worst.
The 0427 Ah update was from a calibration charge from 2 blinking bars using level1 EVSE. I was a little surprise to see the 0429 update, which must have happened because it was charged until stop. I was relieved to see the Ah increased; though I must admit I rarely to a cal charge.
Planning to execute another cal charge soon and hoping for another bump in Ah
In my previous analysis of data from our CZero I did not take the storage degradation of the battery into account. In the 2008 Yuasa technical report on the LEV50 cell figure 8 shows Yuasa’s measurements of this degradation. With some minor modifications I’ve reproduced this figure here.
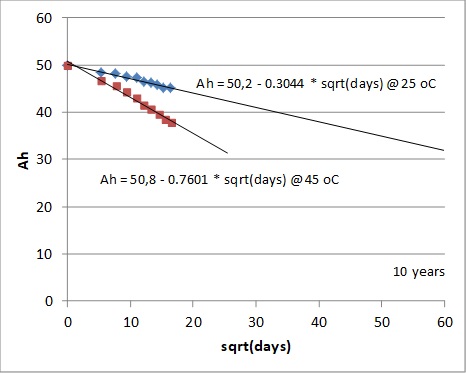
Figure 1 Battery capacity as a function of storage time at two temperatures (Yuasa 2008).
Yuasa found that a model relating the degradation to the squire root of days fit well with their measurements. This means that degradation slows as the battery ages. At the same time temperature has a large effect on the rate of degradation. As the battery is not in use or under charge the temperature in this case is the air temperature around the battery.
Yuasa released a second technical report in 2012 on the LEV50N cell. This has a lower rate of storage degradation than the LEV50. However I’m fairly sure that my battery uses the LEV50. If anyone wants a graph for the LEV50N similar to figure 1 please let me know.
Appling this squire root model to my data I get the result shown in the next figure. The process of data collection and analysis is described in an earlier post on this forum.
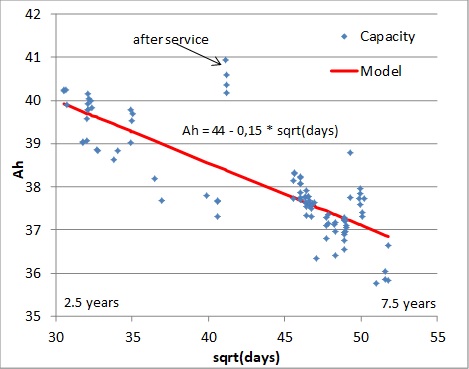
Figure 2 Capacity degradation for my battery as a function of the square root of days since the battery was made
My car is a 2012 model, which I bought as its first owner in June 2014, almost two years after it was imported in this country in Sept. 2012. The car only had about 2000 km when I drove it off of the dealer’s lot. By June 2019 the mileage was 89,000 km.
The first measurements shown in figure 2 are from July 2014 and the most recent are from June 2019. Unfortunately, I don’t know when the battery was made. For the age of the battery shown in figure 2 I just assumed a manufacturing date of Jan. 1 2012. Within limits the choice of a manufacturing date has little effect on the slope of the line in figure 2 namely 0.15 (Ah/sqrt(days)). This is the rate of degradation since I bought the car.
The rate of degradation for my battery is about half the rate at 25oC measured by Yuasa and shown in figure 1. We can use the rates shown in figure 1 to compute the temperature that gives the rate shown in figure 2.
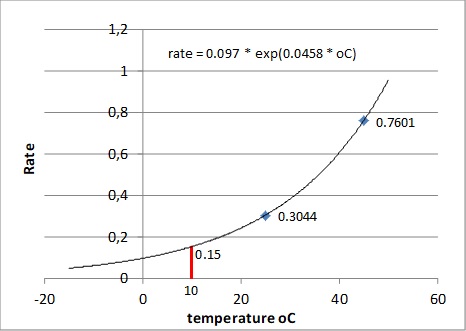
Figure 3 The rate of battery storage degradation as a function of the temperature
Figure 3 shows the two rates measured by Yuasa with a line showing the rate as an exponential function of temperature. I chose an exponential function because I assume that this is a typical chemical reaction. Among other things an exponential function won’t predict a rate less than zero no matter how cold the battery gets. Using the inverse of the function in figure 3 and the rate of 0.15 I get a temperature of 10 oC, which is a degree or 2 above the average air temperature here in Denmark. If this analysis is correct then all of the degradation of the battery since I bought our car can be explained by the storage degradation. Charge and use cycles appear to be of little consequence.
The choice of a date for the manufacture of the battery does affect the predicted original capacity of the battery of 44 Ah shown in figure 2. The further back the manufacture date the greater the predicted original capacity. However to reach the specified capacity of 50 Ah at the present rate of degradation I would have to assume that my battery was manufactured in 2008. This seems unlikely. It’s more likely that the battery deteriorated at a greater rate before I bought it, maybe because it was in the dealers showroom and therefore warmer than it would have been if kept outdoors. Another explanation is that the true rate of degradation is greater than that I have seen so far. We know that the battery temperature is 5 to 10 oC greater than the air temperature when the battery is in use or while charging so the average battery temperature over the whole day must be greater than 10oC. I suspect that as I collect more data a new analysis will show a greater rate of degradation.
The most obvious implication here is that the buyer will never get a battery with the specified capacity. This explains the observation made by others on this forum that the battery capacity of a new car is always less than 50Ah. Storage degradation also means that the car should be kept as cold as possible both before and after sale. I’m not sure that air-conditioning the garage is a good idea but heating it certainly isn’t. Lastly it appears that within limits how we use and charge the battery has less effect on the rate of degradation than the average air temperature.
There is a lot of variation in the data for my battery shown in figure 2. Some of this is due to temperature but random errors in measurements also play a role. Therefore I will continue to treat my battery with care.
Figure 1 Battery capacity as a function of storage time at two temperatures (Yuasa 2008).
Yuasa found that a model relating the degradation to the squire root of days fit well with their measurements. This means that degradation slows as the battery ages. At the same time temperature has a large effect on the rate of degradation. As the battery is not in use or under charge the temperature in this case is the air temperature around the battery.
Yuasa released a second technical report in 2012 on the LEV50N cell. This has a lower rate of storage degradation than the LEV50. However I’m fairly sure that my battery uses the LEV50. If anyone wants a graph for the LEV50N similar to figure 1 please let me know.
Appling this squire root model to my data I get the result shown in the next figure. The process of data collection and analysis is described in an earlier post on this forum.
Figure 2 Capacity degradation for my battery as a function of the square root of days since the battery was made
My car is a 2012 model, which I bought as its first owner in June 2014, almost two years after it was imported in this country in Sept. 2012. The car only had about 2000 km when I drove it off of the dealer’s lot. By June 2019 the mileage was 89,000 km.
The first measurements shown in figure 2 are from July 2014 and the most recent are from June 2019. Unfortunately, I don’t know when the battery was made. For the age of the battery shown in figure 2 I just assumed a manufacturing date of Jan. 1 2012. Within limits the choice of a manufacturing date has little effect on the slope of the line in figure 2 namely 0.15 (Ah/sqrt(days)). This is the rate of degradation since I bought the car.
The rate of degradation for my battery is about half the rate at 25oC measured by Yuasa and shown in figure 1. We can use the rates shown in figure 1 to compute the temperature that gives the rate shown in figure 2.
Figure 3 The rate of battery storage degradation as a function of the temperature
Figure 3 shows the two rates measured by Yuasa with a line showing the rate as an exponential function of temperature. I chose an exponential function because I assume that this is a typical chemical reaction. Among other things an exponential function won’t predict a rate less than zero no matter how cold the battery gets. Using the inverse of the function in figure 3 and the rate of 0.15 I get a temperature of 10 oC, which is a degree or 2 above the average air temperature here in Denmark. If this analysis is correct then all of the degradation of the battery since I bought our car can be explained by the storage degradation. Charge and use cycles appear to be of little consequence.
The choice of a date for the manufacture of the battery does affect the predicted original capacity of the battery of 44 Ah shown in figure 2. The further back the manufacture date the greater the predicted original capacity. However to reach the specified capacity of 50 Ah at the present rate of degradation I would have to assume that my battery was manufactured in 2008. This seems unlikely. It’s more likely that the battery deteriorated at a greater rate before I bought it, maybe because it was in the dealers showroom and therefore warmer than it would have been if kept outdoors. Another explanation is that the true rate of degradation is greater than that I have seen so far. We know that the battery temperature is 5 to 10 oC greater than the air temperature when the battery is in use or while charging so the average battery temperature over the whole day must be greater than 10oC. I suspect that as I collect more data a new analysis will show a greater rate of degradation.
The most obvious implication here is that the buyer will never get a battery with the specified capacity. This explains the observation made by others on this forum that the battery capacity of a new car is always less than 50Ah. Storage degradation also means that the car should be kept as cold as possible both before and after sale. I’m not sure that air-conditioning the garage is a good idea but heating it certainly isn’t. Lastly it appears that within limits how we use and charge the battery has less effect on the rate of degradation than the average air temperature.
There is a lot of variation in the data for my battery shown in figure 2. Some of this is due to temperature but random errors in measurements also play a role. Therefore I will continue to treat my battery with care.
CZeroOwner, thank you so much for attempting to model and quantify our battery degradation. Concluding that the degradation in your car seems to be primarily time-related seems counter-intuitive although possibly quite valid if you are a featherfoot driver and adhere to a conservative charging regimen. Considering the 87,000km (54K miles) you have driven in exactly five years it would seem to me that there should be some component attributable to battery wear-down degradation as well. In any case, thank you for sharing your study's results and hopefully you can keep accumulating data and refining your algorithm(s).CZeroOwner said:...If this analysis is correct then all of the degradation of the battery since I bought our car can be explained by the storage degradation. Charge and use cycles appear to be of little consequence...
Thank you!
DBMandrake
Well-known member
I can save you a bit of speculating here.CZeroOwner said:The choice of a date for the manufacture of the battery does affect the predicted original capacity of the battery of 44 Ah shown in figure 2. The further back the manufacture date the greater the predicted original capacity. However to reach the specified capacity of 50 Ah at the present rate of degradation I would have to assume that my battery was manufactured in 2008. This seems unlikely. It’s more likely that the battery deteriorated at a greater rate before I bought it, maybe because it was in the dealers showroom and therefore warmer than it would have been if kept outdoors. Another explanation is that the true rate of degradation is greater than that I have seen so far. We know that the battery temperature is 5 to 10 oC greater than the air temperature when the battery is in use or while charging so the average battery temperature over the whole day must be greater than 10oC. I suspect that as I collect more data a new analysis will show a greater rate of degradation.
The most obvious implication here is that the buyer will never get a battery with the specified capacity. This explains the observation made by others on this forum that the battery capacity of a new car is always less than 50Ah. Storage degradation also means that the car should be kept as cold as possible both before and after sale. I’m not sure that air-conditioning the garage is a good idea but heating it certainly isn’t. Lastly it appears that within limits how we use and charge the battery has less effect on the rate of degradation than the average air temperature.
The factory new usable capacity of these batteries is not 50Ah.This is for two reasons. One is that the cells are not used over the full voltage range that Yuasa specifies to achieve 50Ah - in the car they are only charged up to 4.1 volts and only discharged to about 3.6 volts. The 50Ah capacity is based on 4.2 volts to 3.0 volts. So only approximately 90% of the cell's capacity can be used over this reduced voltage range. This is done to maximise cycle life of the battery. If they were used over their full 50Ah range the cycle life would be halved.
We now know what the factory new reported usable capacity is based on the BMU reset I recently did and the figure is 45.8Ah.
If you extrapolate your results back to 45.8Ah instead of 50Ah I don't think you'll see much early rapid degradation.
The second reason is the BMS keeps a usable capacity buffer of about 1Ah from the worst cell in the pack, in addition to the tortoise mode capacity. So if the worst cell measures 36Ah the BMS will report a usable capacity of 35Ah in software such as Canion, and use this for range calculations. This is probably to allow for uncertainty in the measurement.
I've proven this in the measurements I took during and after a full battery calibration. I've done this calibration twice now, the calibration reports the capacity of the best and worst cell and you can see that in both cases it initially sets the "usable" capacity to about 2Ah below the worst cell, (being conservative I guess) but then rebounds by 1Ah after a period of driving and use.
So this small buffer will also cause the reported Ah capacity to be about 1Ah less than the "true" battery capacity, which is probably about 46.8Ah. But if you are going by the usable Ah capacity as reported by Canion, (which is the only figure available outside of performing the full battery calibration routine) 45.8Ah is the figure you should use for 100% SoH of a new battery.
In the post above I showed that the higher the temperature the faster the degradation. However temperature also has an immediate effect on capacity in the opposite direction, the higher the temperature the greater the capacity. I have tried to find this relationship in my data without success. This is probably because my analysis is based on extracting the car’s estimate of the battery capacity from the data and this estimate changes in slow steps. Therefore the car’s estimate reflects more the average battery temperature during charging over the previous weeks rather than the actual battery temperature.
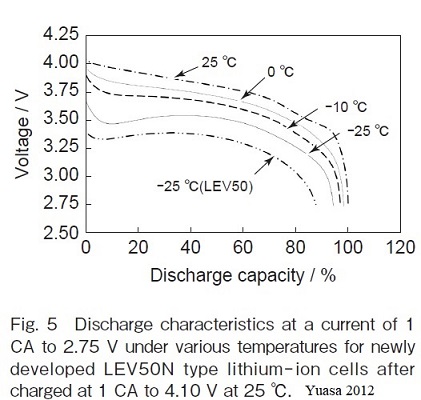
To get an estimate of this immediate effect I went back to the Yuasa tech report for the LEV50 cell. They measured the cell capacity at different temperatures and presented the results in the figure below.
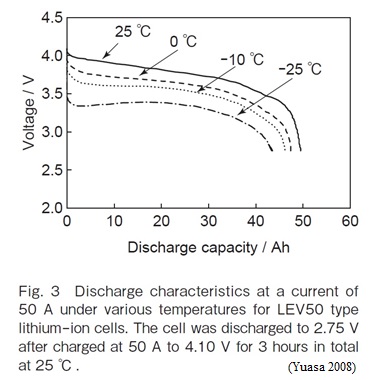
The lowest point on each curve in figure 3 is the capacity in Ah at that temperature. Plotting these capacities against temperature I get the next figure.
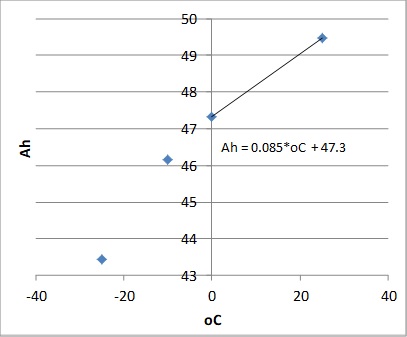
Figure 4 Capacity as a function of temperature based on Yuasa’s measurements of a new LEV50 cell
Note that the relationship between temperature and capacity isn’t linear but slightly curved. However, almost all of my battery temperatures while driving are between 0 and 25oC. The maximum temperature I’ve observed is 35oC. So to keep things simple I’ve written a linear equation in the graph based on the 0 and 25oC points. I expect that the slope of the line, 0.085 Ah/oC, doesn’t change as the battery ages but I don’t know this for sure. On the other hand the capacity at 0oC 47.3 Ah will decrease with time. At present my battery capacity at 0 oC is about 35 Ah and 37 Ah at 25 oC.
One interesting thing is that according to Yuasa the cell capacity is 50 Ah only at or above 30oC. This is another factor to take into consideration when talking about the original capacity of our batteries.
To get an estimate of this immediate effect I went back to the Yuasa tech report for the LEV50 cell. They measured the cell capacity at different temperatures and presented the results in the figure below.
The lowest point on each curve in figure 3 is the capacity in Ah at that temperature. Plotting these capacities against temperature I get the next figure.
Figure 4 Capacity as a function of temperature based on Yuasa’s measurements of a new LEV50 cell
Note that the relationship between temperature and capacity isn’t linear but slightly curved. However, almost all of my battery temperatures while driving are between 0 and 25oC. The maximum temperature I’ve observed is 35oC. So to keep things simple I’ve written a linear equation in the graph based on the 0 and 25oC points. I expect that the slope of the line, 0.085 Ah/oC, doesn’t change as the battery ages but I don’t know this for sure. On the other hand the capacity at 0oC 47.3 Ah will decrease with time. At present my battery capacity at 0 oC is about 35 Ah and 37 Ah at 25 oC.
One interesting thing is that according to Yuasa the cell capacity is 50 Ah only at or above 30oC. This is another factor to take into consideration when talking about the original capacity of our batteries.
Here is the graph from the Yuasa Tech Report 2012 showing the effect of temperature on the capacity of the LEV50N cell.
The next figure is the same one as figure 4 in the post above this time with the capacities for the LEV50N added.
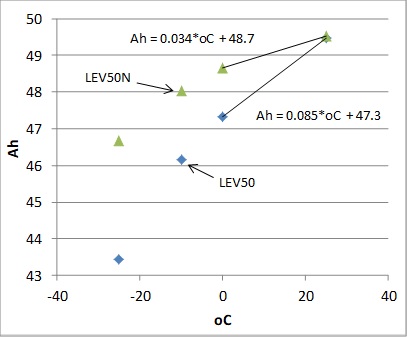
Figure 6 Capacity as a function of temperature based on Yuasa’s measurements of the LEV50 cell and the LEV50N cell
The LEV50N cell shows an impressive improvement in cold weather performance compared with the LEV50. It would be very interesting to see if this improvement can be observed in cars with the 50N cell.
I’m working on a comparison of the storage degradation for the two cells.
The next figure is the same one as figure 4 in the post above this time with the capacities for the LEV50N added.
Figure 6 Capacity as a function of temperature based on Yuasa’s measurements of the LEV50 cell and the LEV50N cell
The LEV50N cell shows an impressive improvement in cold weather performance compared with the LEV50. It would be very interesting to see if this improvement can be observed in cars with the 50N cell.
I’m working on a comparison of the storage degradation for the two cells.
Here is a reproduction of figure 8 from the Yuasa Tech Report 2012. It shows the storage degradation for the LEV50N cell. I had to modify the original figure quite a bit in order to make it look like the similar figure for the LEV50 shown in a post above. For this reason, I’m not as sure of the numbers shown in this figure as I am for the LEV50 cell. Be that as it may there is no doubt that the 50N cell degrads much slower than the 50 cell and Yuasa deserves credit for the improvement.
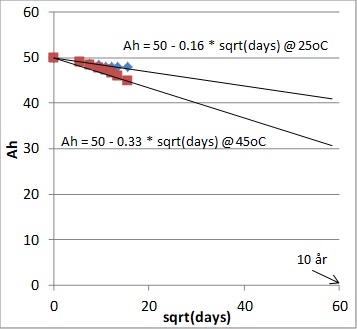
Figure 1 Storage degradation of the LEV50N cell based on the Yuasa Tech Report from 2012
In the following table I have tried to combine the effects of operating temperature that increases the immediate capacity and the overall average temperature that increases the rate of degradation.
Table 1 Expected capacity in Ah based on the Yuasa Tech Reports from 2008 and 2012
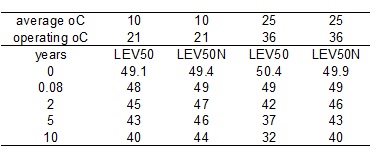
Note that 0 years in the table is the manufacturing date for the cells. 0.08 years equals 1 month, a possible deliver date for the car and battery. An average temperature of 10oC and an operating temperature of 21oC apply to my battery. The operating temperature of 36oC at an average temperature of 25oC is a guess. My battery has a capacity of 36 Ah at 7.5 years compared to 40 Ah after 10 years shown in the table. So the numbers here are probably optimistic. On the other hand I believe my battery was mistreated before I bought the car. In any event the effects of use and charge cycles are not included in the table. Because the storage degradation of the 50N cell is much slower than the 50 cell I would expect that the effect of use and charging would be more noticeable for the 50N cell.
Lastly, it’s true for both cells that I'm trying to predict the condition of the cell after 10 years based on less than 9 months of measurements.
Figure 1 Storage degradation of the LEV50N cell based on the Yuasa Tech Report from 2012
In the following table I have tried to combine the effects of operating temperature that increases the immediate capacity and the overall average temperature that increases the rate of degradation.
Table 1 Expected capacity in Ah based on the Yuasa Tech Reports from 2008 and 2012
Note that 0 years in the table is the manufacturing date for the cells. 0.08 years equals 1 month, a possible deliver date for the car and battery. An average temperature of 10oC and an operating temperature of 21oC apply to my battery. The operating temperature of 36oC at an average temperature of 25oC is a guess. My battery has a capacity of 36 Ah at 7.5 years compared to 40 Ah after 10 years shown in the table. So the numbers here are probably optimistic. On the other hand I believe my battery was mistreated before I bought the car. In any event the effects of use and charge cycles are not included in the table. Because the storage degradation of the 50N cell is much slower than the 50 cell I would expect that the effect of use and charging would be more noticeable for the 50N cell.
Lastly, it’s true for both cells that I'm trying to predict the condition of the cell after 10 years based on less than 9 months of measurements.
According to the Yuasa tech report that I quoted in an earlier post, temperature should affect the capacity of the battery. Based on measurements on a new LEV50 cell Yuasa would expect the capacity to decrease from the nominal value of 50 Ah at about 30oC to 47.6 Ah at 0oC. However there is little or no correlation between temperature and capacity in the data reported by the car. I have observed a long term deterioration of capacity which I believe is strongly affected by the temperature but there doesn’t appear to be a day to day change in capacity as the temperature changes. We know that car’s estimate of the capacity is slow to change but I would still expect more correlation between temperature and capacity than I have seen. This is another reason for developing a simple independent method for measuring the battery capacity.
I believe that this method must necessarily compute the SoC using the battery voltage. According to theory, the no load or open circuit voltage of the battery should be strongly dependent on the SoC and weakly dependent on the temperature. Therefore, I searched my data for periods of 10 min. or more in which the car was turned on but parked, maybe periods waiting for passengers with the radio on. The 10 min allows the battery to reach a constant voltage. There weren’t many periods like that so I had to supplement with measurements specifically for this purpose. The results can be seen in the graph below.
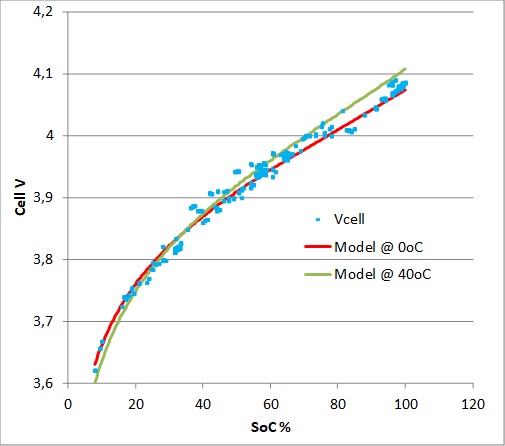
Figure 1 The average cell voltage as a function of the SoC under low load conditions (< 1 amp)
I fitted the data to a simple model of a lithium cell that I found in the literature. The result can be seen in figure 1 as two lines, one for 0oC and the other for 40oC, the range of temperatures observed. The measurements that aren’t between the lines are possibly due to random errors or errors in the car’s estimate of the SoC.
The next step was to use the model to compute the SoC during slow charging (< 5 amps). The BMU adjusts the charging voltage to maintain a fairly constant current so the dynamic effects are minimized. Therefore I only added a simple internal resistance to the model to compensate for the added amps. At the same time I computed the Ahs accumulated in the battery. Measuring the slope of the Ah to SoC line gave the capacity. The results are shown in the next graph.
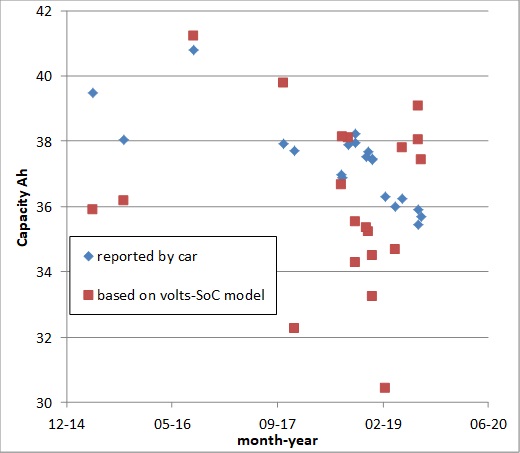
Figure 2 The capacity during slow charging (< 5 amps).
You can see in figure 2 that the only agreement between the cars estimate of the capacity and the estimate using my method is the general range of the capacity. Among other things my method shows no long term downward trend in capacity. That the range is the same is probably because I calibrated the model using the car’s estimate of the SoC.
However, my method does show a correlation with the temperature when the car was charged. This can be seen as a drop to a minimum of 31 Ah in February 2019 and a subsequent increase to 39 Ah in July 2019. The numerical correlation between capacity and battery temperature is shown in the next graph.
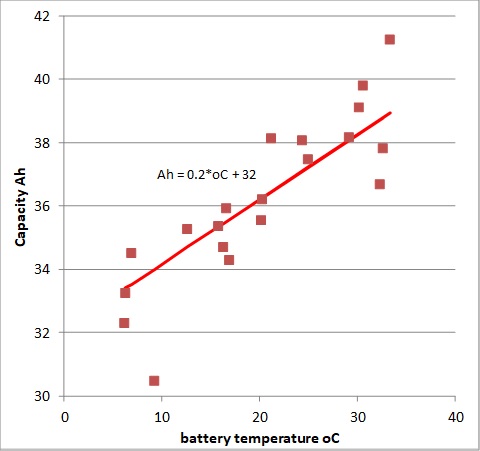
Figure 3 the correlation between temperature during slow charging and the capacity measured using the volts -SoC model
This correlation is much larger than the one observed by Yuasa in the lab. Ignoring the highest and lowest values in figure 3 there is a 5 Ah difference between 8oC and 34oC. Based on Yuasa’s measurements one would only expect a 2 Ah difference. This is definitely a work in progress but if this analysis is correct then the temperature at which the battery’s capacity is measured or calibrated will have a significant effect on the result. I’m thinking specifically of DBMandrake’s very interesting measurements of capacity. I would like to know the battery temperatures at which the measurements were made.
I believe that this method must necessarily compute the SoC using the battery voltage. According to theory, the no load or open circuit voltage of the battery should be strongly dependent on the SoC and weakly dependent on the temperature. Therefore, I searched my data for periods of 10 min. or more in which the car was turned on but parked, maybe periods waiting for passengers with the radio on. The 10 min allows the battery to reach a constant voltage. There weren’t many periods like that so I had to supplement with measurements specifically for this purpose. The results can be seen in the graph below.
Figure 1 The average cell voltage as a function of the SoC under low load conditions (< 1 amp)
I fitted the data to a simple model of a lithium cell that I found in the literature. The result can be seen in figure 1 as two lines, one for 0oC and the other for 40oC, the range of temperatures observed. The measurements that aren’t between the lines are possibly due to random errors or errors in the car’s estimate of the SoC.
The next step was to use the model to compute the SoC during slow charging (< 5 amps). The BMU adjusts the charging voltage to maintain a fairly constant current so the dynamic effects are minimized. Therefore I only added a simple internal resistance to the model to compensate for the added amps. At the same time I computed the Ahs accumulated in the battery. Measuring the slope of the Ah to SoC line gave the capacity. The results are shown in the next graph.
Figure 2 The capacity during slow charging (< 5 amps).
You can see in figure 2 that the only agreement between the cars estimate of the capacity and the estimate using my method is the general range of the capacity. Among other things my method shows no long term downward trend in capacity. That the range is the same is probably because I calibrated the model using the car’s estimate of the SoC.
However, my method does show a correlation with the temperature when the car was charged. This can be seen as a drop to a minimum of 31 Ah in February 2019 and a subsequent increase to 39 Ah in July 2019. The numerical correlation between capacity and battery temperature is shown in the next graph.
Figure 3 the correlation between temperature during slow charging and the capacity measured using the volts -SoC model
This correlation is much larger than the one observed by Yuasa in the lab. Ignoring the highest and lowest values in figure 3 there is a 5 Ah difference between 8oC and 34oC. Based on Yuasa’s measurements one would only expect a 2 Ah difference. This is definitely a work in progress but if this analysis is correct then the temperature at which the battery’s capacity is measured or calibrated will have a significant effect on the result. I’m thinking specifically of DBMandrake’s very interesting measurements of capacity. I would like to know the battery temperatures at which the measurements were made.
A couple of weeks ago our CZero was in for service. Part of the service was a measurement of the battery capacity. At the same time, I got the previous capacity measurement made 3 years ago. Here they are:
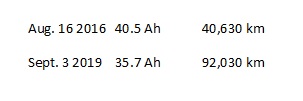
These values are plotted in the graph below along with the capacity reported by the car. Note that the x axis is the square root of days since June 2012, my present guess for the date the battery was manufactured. I use the square root of days so that I can compare the results with the Yuasa tech report mentioned in an earlier post.
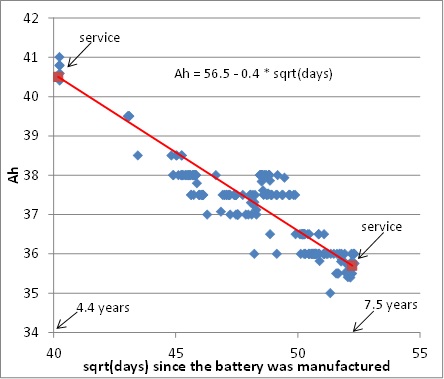
You can see that there is fairly good agreement between the two capacity measurements. The cars capacity measurement is greater than the red line during the warm months and less during the colder mouths but the overall slope is the same. However the slope is significantly greater than the slope of a similar line in a previous post, so the battery is degrading faster than I had hoped. It is also degrading faster than I would expect based only on storage degradation at 10oC, the average air temperature here in Denmark. So the cycles of driving and charging are also wearing the battery down. At the present rate of about 50 km/day the cycling degradation is in fact greater than the storage degradation. At a guess about 1/3 is due to storage and 2/3 due to cycling.
Note too that the measurements predict that the battery had a capacity of 56.5 Ah at the estimated time of manufacture. This is much more than the battery’s nominal capacity of 50 Ah so the rate of degradation before the first measurements shown in the graph must have been slower. This agrees well with the fact that car only travelled 2000 km during the 2 years from 2012 when it arrived in this country until we bought it in 2014. During those 2 years only storage degradation was at work.
These values are plotted in the graph below along with the capacity reported by the car. Note that the x axis is the square root of days since June 2012, my present guess for the date the battery was manufactured. I use the square root of days so that I can compare the results with the Yuasa tech report mentioned in an earlier post.
You can see that there is fairly good agreement between the two capacity measurements. The cars capacity measurement is greater than the red line during the warm months and less during the colder mouths but the overall slope is the same. However the slope is significantly greater than the slope of a similar line in a previous post, so the battery is degrading faster than I had hoped. It is also degrading faster than I would expect based only on storage degradation at 10oC, the average air temperature here in Denmark. So the cycles of driving and charging are also wearing the battery down. At the present rate of about 50 km/day the cycling degradation is in fact greater than the storage degradation. At a guess about 1/3 is due to storage and 2/3 due to cycling.
Note too that the measurements predict that the battery had a capacity of 56.5 Ah at the estimated time of manufacture. This is much more than the battery’s nominal capacity of 50 Ah so the rate of degradation before the first measurements shown in the graph must have been slower. This agrees well with the fact that car only travelled 2000 km during the 2 years from 2012 when it arrived in this country until we bought it in 2014. During those 2 years only storage degradation was at work.
Similar threads
- Replies
- 17
- Views
- 958
- Replies
- 2
- Views
- 419
- Replies
- 1
- Views
- 237
- Replies
- 10
- Views
- 2K
- Replies
- 2
- Views
- 426