Malm
Well-known member
My turtle turns on at 9,5%.
https://www.youtube.com/watch?v=7-IGctenit4
https://www.youtube.com/watch?v=7-IGctenit4
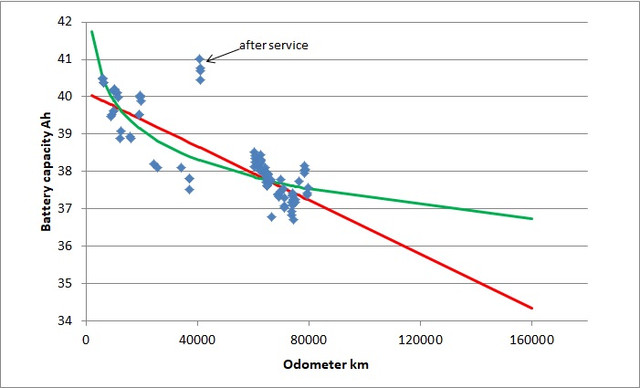
bobakka said:...I have measured battery capacity at the dealer every year since I bought the iMiev i 2011:
Date: Km: CPU: Battery current capacity:
27. 3.2012 19929 1917 42,3 Ah
19. 4.2013 41183 4026 40,8 Ah
17. 1.2014 58661 5596 39,4 Ah
14.11.2014 No battery report, only that "Battery is OK"
5.10.2015 94818 9386 44,1 Ah
1.12.2015 98199 9763 39,3 Ah
1.12.2015 98227 9764 39,2 Ah
1.12.2015 98246 9768 45,8 Ah
...
I complained and the dealer performed a new set of tests December 1st.
He found that the battery capacity increased by 15%! during the service and was quite happy!
This is clearly wrong, but what can I do when the dealer says "Battery is OK".
CZeroOwner, thank you for your graphs and analysis. Agree that the log line is perhaps a better approximation, which bodes well for our future.CZeroOwner said:...There are other reasons to believe that a natural log model best describes battery aging so with a bit of luck I will have a useable battery for some years to come.
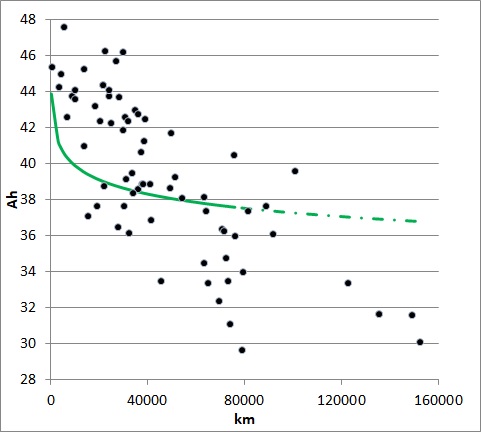
Let's remember that this is the capacity as reported by the on-board BMS. The fact that range can miraculously be restored (real-world, achieved range) after the "battery smoothing" process suggests to me that perhaps the BMS is overly pessimistic about degradation. Perhaps Mitsubishi are happy with this; mostly this should be invisible to the user, and it causes less real depth of discharge, saving the battery (at the expense of potentially a lot of customer inconvenience).CZeroOwner said:The black dots in the graph above are battery capacities for 44 German owned iMiev/CZero/iOns collected by datom.
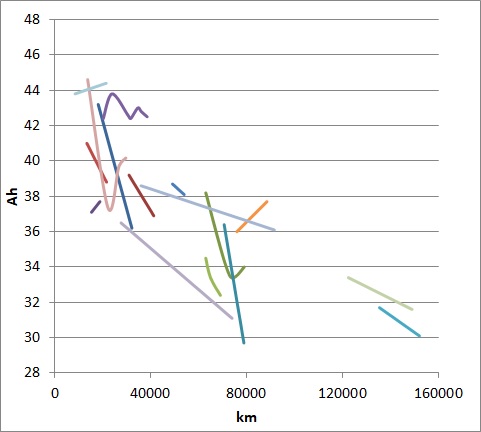
Indeed. Or it could be the BMS being overly cautious / pessimistic. It would be really good to know which it is.What is interesting is the wide range of the rates of decline. This may be due to variations in the manufacture of the battery cells but it could also indicate that there are things that we can do or avoid doing that will extend battery life.
Just so you know, the maximum input power and maximum output power figures are not a measure of the health of the battery with respect to degradation, so you won't see any difference here between an old battery and a new one.jray3 said:Coulomb, thank you for your ongoing efforts. I'll throw in another data point. I'm planning to replace MR BEAN's battery with a junkyard salvage unit shortly after 100k miles, currently at 99,220 on the odometer.
Current stats according to my MUT3 clone:
Battery current capacity: 27.3 Ah
Battery maximum input power: 45.75 kW
Battery maximum output power: 63.50 kW
Voltage spread between high and low cells is now as high as 0.19 V.
If it was only the cell capacity that has degraded then rapid charge times would actually get faster. The thing that slows down rapid charging time is increased cell internal resistance, which is usually a sign of cell(s) that are starting to fail prematurely.DCFC sessions are running significantly longer these days with a degraded battery plus temperatures near freezing. The pack warms up nicely, perhaps too warm at 39 Celsius (102 F) on module 3 and ten degrees C cooler elsewhere in the pack.
There are several.krox said:Is there a software for checking the HV battery capacity for Android?
Enter your email address to join: