Benchmarking to measure capacity loss

Mitsubishi i-MiEV Forum

Help Support Mitsubishi i-MiEV Forum:

This site may earn a commission from merchant affiliate links, including eBay, Amazon, and others.
Sorry. Not private anymore. Remember, i'm the only one that can go to 0,0% and with 3,20 V in the weakest. All of you will stop at an higher SoC.
 
Battery capacity droped by 6% after 42000 km and 20 months.

Temperatures well above 20° C were ideal for retest the battery capacity.

I squeezed out the last remaining electrons. I just returned home with pushing Eli last few meters. After six hours consumption meter has stopped at 17.4 kWh.

The figure shows that the amount of energy required to charge 0-100% SOC decreased by 6% vs. 18.5 kWh measured in similar temperature conditions in 2012. The range (sum of daily commute km and RR) on my usual trip droped from 160km (2012) to 150 km (now), so also 6% drop.

Some interesting data:
Screenshot_2014-05-25-18-44-34.png


Summer temperatures are finaly here, so the battery cells temperatures increased accordingly. The graph shows cell temp. at 0% SOC. During charging, the average temperature dropped by two degrees C.

Screenshot_2014-05-25-18-44-38.png

At the lowest SOC as expected cell voltage dissipated in a very large range of 410mV . Usually while driving in a safe SOC range voltage range stay close between 10 and 40 mV.

After a few minutes of charging, the voltage difference droped to the usual 5 to 10 mV .

More frequent full discharge can not help battery's health, so I'll repeat similar test next spring at similar time and temperature. I expect about 10% loss then.
 
I measured 3 different data in 2012 (new car) and 2014 at similar conditions (temp, weather, tire pressure...):

1. kWh to charge from 0-100% SOC: 17.4 (2014) / 18.5 (2012) = 0,94
2. kWh to charge from --- to 100% SOC: 15.6 (2014) / 16.6 (2012) = 0,94
3. sum of km driven and RR after my typical trip: 150 (2014) / 160 (2012) = 0,94

The same result three times tells me this is reliable enough benchmarking method. Sure there are differences (EVSE types for ex.), but if we measure under the same or at least very similar conditions, we can rely on this method. It's not perfect but the best I know without using special tools.
 
Nice data. Not everybody let the car go so down, like me and you. We know that going so low will never make our batteries last longer, but that's the only way to know the degradation evolution.

Yes Zelenec, I agree, your finding data that matches very well. That is working well because you go to 0,0% SoC. In some cars it will stop before reaching 0,0% SoC, maybe 5%, and then numbers will not fit with each other.

Mine goes to 0,0% too and can charge something like 15,9 from the wall. From 0 to 100% - 15,9/18,5=0,86. 14% degradation in the end of 3 years and 2 months.

Zelenec - 20 months - 6%
Malm - 38 months - 14% (here temperatures are usually higher)
 
Thanks Malm to share with us your informations, you are on the path of those famous Portuguese navigators http://springday2004.planetaclix.pt/page15.htm taking us to some unknown territories.
With the help of one of your video, I picked up some data of one of your recharge to make a curve, Battery voltage versus State of Charge.
You reach 361 Volt at 80% SoC, my three years old Peugeot iOn on the road since two years with 20 000 km now, still reach 361 Volt at 96% SoC, we might suspect that less active components make the battery reaching 361 Volt at a lower SoC.
With the help of CaniOn and Seclog data, the conclusion is, that if you want to spend some holidays in a warm country, this is better to go Portugal than Normandy.


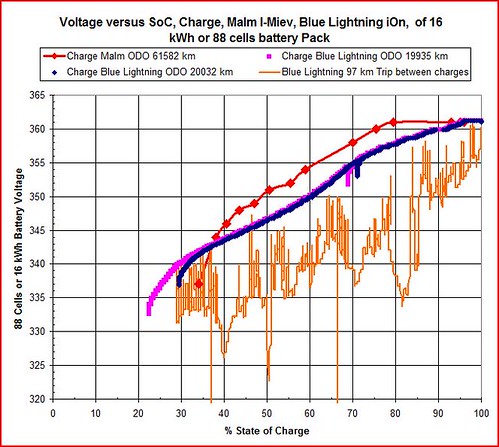
Battery Volt versus SoC with Malm


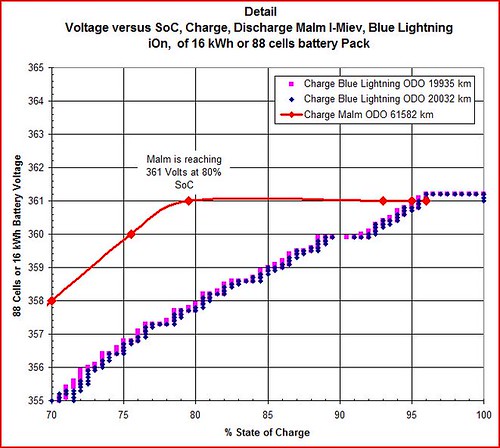
Battery Detail Volt versus SoC with Malm


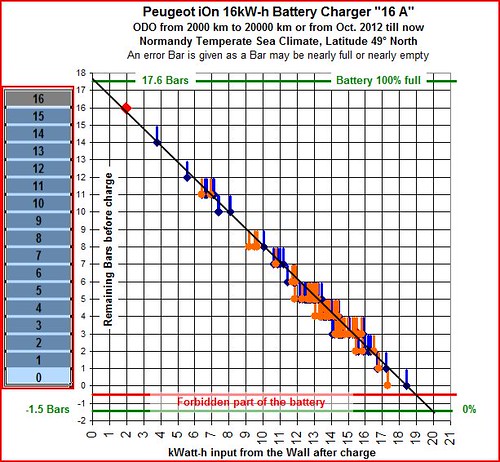
Remaining Bars versus Recharge at wall

Charge at the wall is monitored with a Kill A Watt
If the battery was empty, a simple line projection shows it would need 20 kwh for a full recharge at the wall with a Europe "16 A" 220 Volt Charger.
In other words, we do not need to empty the battery to see how much is needed for a theorical full charge at the wall.
Knowing the charge efficiency with a Europe "16 A" Charger, I could get the real charge of the battery.
By example, if the efficiency of the charge is of 82%, then the load in the battery is of 20 kwh at the wall multiplied by 0.82 which give 16.4 kW-h.
Recharge is always done without premature interruption at night.


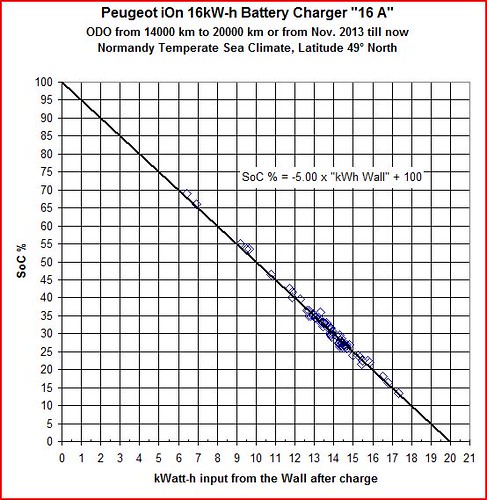
SoC versus Charge at the Wall
 
Thank you. I will go for places never visited, see things never seen, my world is my i-MiEV and it's round too. Not the first Portuguese being like that, as you say.

My I-MiEV data. That's a hell of a story and it's very difficult to explain. That video is to show how temperatures rise, not to show how voltage relates with SoC. Sorry to tell but I can make my i-MiEV show 0,0% SoC and 296 V (https://www.youtube.com/watch?v=PkWW5w2e4XU96) or 4,0% SoC and 283 V (https://www.dropbox.com/s/jb8v89atkh54fds/Para%20l%C3%A1%20dos%203%2C25.png). I think this two data explain my point of view. But I think I can do something like 0,0% SoC and 310 V, if I want, and it's what I call malmonastic magic.

So, many times my i-MiEV is not evaluating the SoC correctly. In that video it surely wasn't.
 
"So I think the line will shift upside, slowly, day by day. The line of my i-MiEV (at that time) will be more close to the truth if we subtract 5% to all values of SoC (I think in that particular video it is miscalculating SoC giving 5% more then it had). Now, things are very different because it finally evaluated his actual capacity and each bar as less energy. He did it last march.

At the time of the video, it had something like 12% degradation.

Great job. Thank you"

After thinking again about that graph, I think the only diference is that my i-MiEV was making an error of 9% in the SoC. If it evaluated correctly the SoC, the three lines should be very similar, but mine should colapse much faster, because of a loss of 14% in the capacity.
 
Back
Top