Is my battery dying ?

Mitsubishi i-MiEV Forum

Help Support Mitsubishi i-MiEV Forum:

This site may earn a commission from merchant affiliate links, including eBay, Amazon, and others.

DBMandrake

Well-known member
Joined
Mar 20, 2017
Messages
301
Location
Scotland
For the last year I've been keeping an eye on my Ion's Ah battery capacity using Diagbox, and there has been a gradual steady, linear decline of capacity that has been in line with or better than other similar mileage cars. Until today my last measurement was in January.

I recently got hold of an Android tablet and have had an OBDLink LX on order for about a week so I can more easily monitor the battery and general functioning of the car. It hasn't arrived yet but should do this week.

As I haven't checked the Ah figure for 3 months with Diagbox I thought I would today, before my adaptor for Canion arrived - I kind of wish I hadn't! :x There has been a steep decline in reported capacity since January:

uc


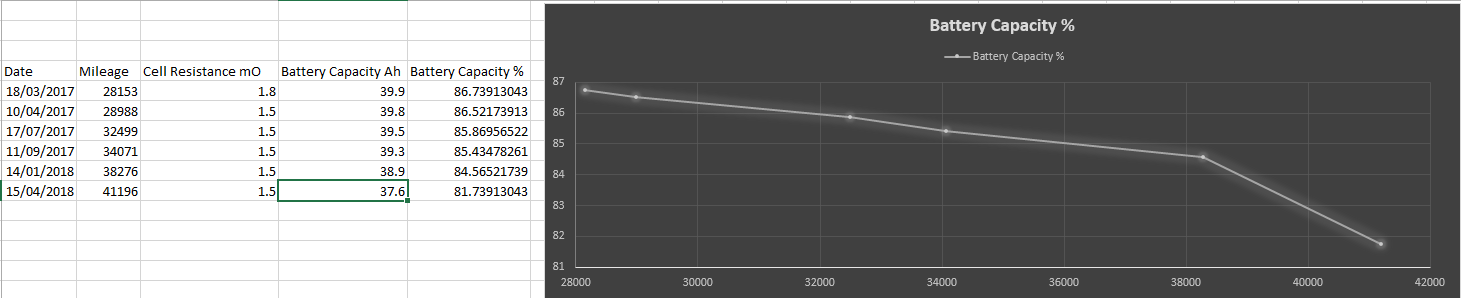
The last reading in January was 38.9Ah now in April 3 months and about 3000 miles later it is 37.6Ah. Prior to this it was dropping about 0.1Ah per 1000 miles, now it has dropped 1.3Ah in 3 months...

While the battery was at about 4 bars I checked the cell voltages - which is a lot more cumbersome than using Canion, I did find Cell A in group 4 was averaging 10-15mV less than it's neighbour cells:

uc


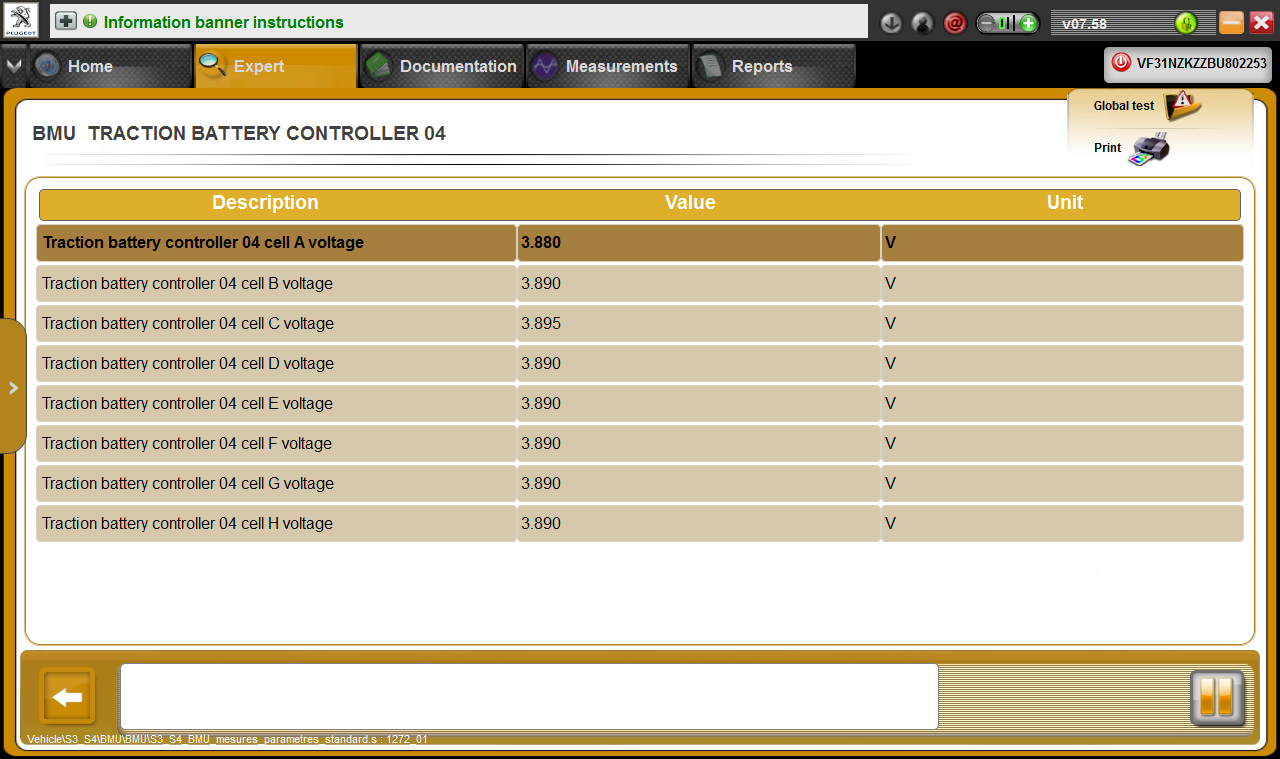
During charging this difference went away as the battery got above 50% or so. I didn't notice any other obvious imbalances in other groups. Obviously any cell imbalances at different states of charge will be much easier to see on Canion's graph so its rather fortuitous that I will have that up and running soon.

I decided that now might be the time to try the battery calibration process in Diagbox. The process is a rather byzantine, manual process compared to the one I've seen described for the MUT tester, here are some of the screens from it during the process, which took over 12 hours in total:

uc


uc


uc


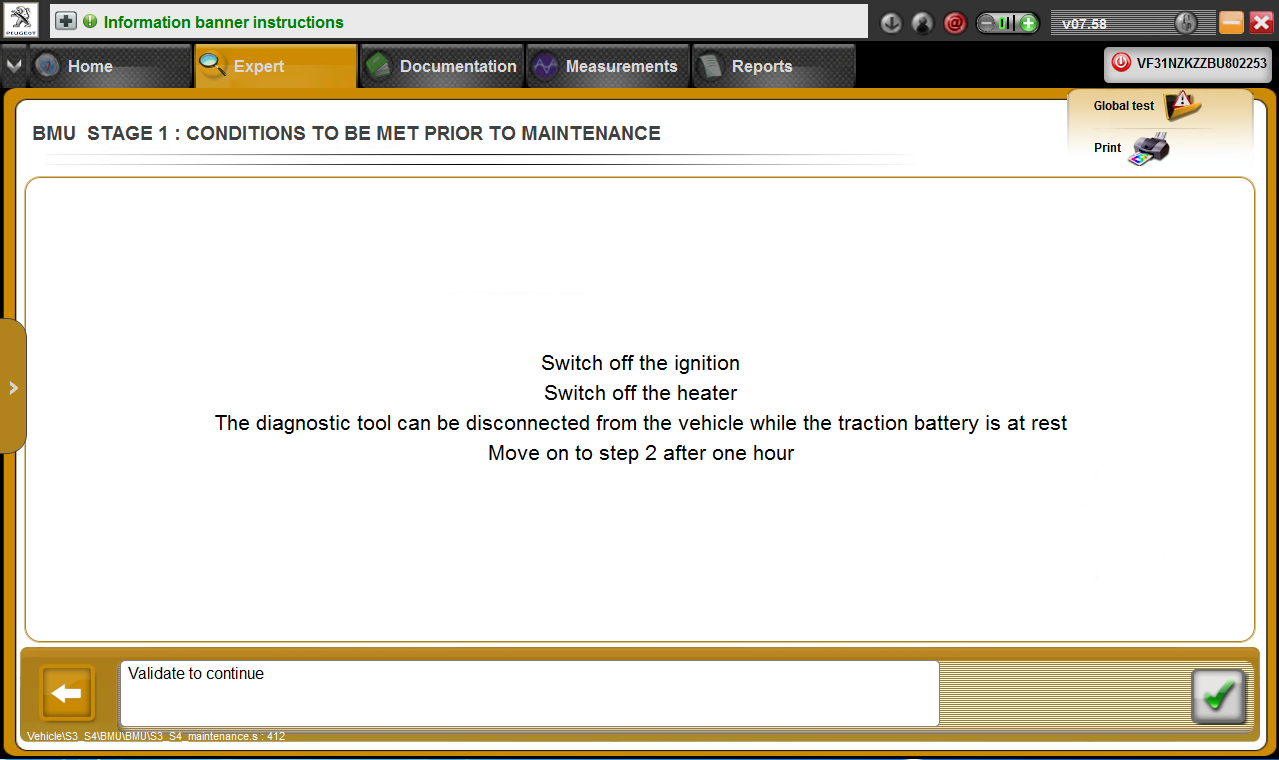
It's a little bit confusing but in essence it goes like this:

1) Discharge the battery to about 5 bars before the test (which I did by driving, as using the heater as recommended was taking too long)

The first step (not show in my screenshots) "configures" something in the BMS before the test proper starts. It seems to change the estimated Ah capacity to a "conservative" figure of 32.5Ah - as soon as I ran this first step I noticed the battery gauge jumped up from 4 bars to 6 bars, and the reported Ah capacity dropped instantly from 37.6Ah to 32.5Ah.

So if you only perform step 1 and don't complete the rest of the calibration process you'll end up with an unrealistically low Ah figure and range estimate!

2) Run the heater until the lowest cell voltage is 3.750 to 3.775 volts. It the allows you to continue. The next step tells you you must wait for at least an hour with the key off.

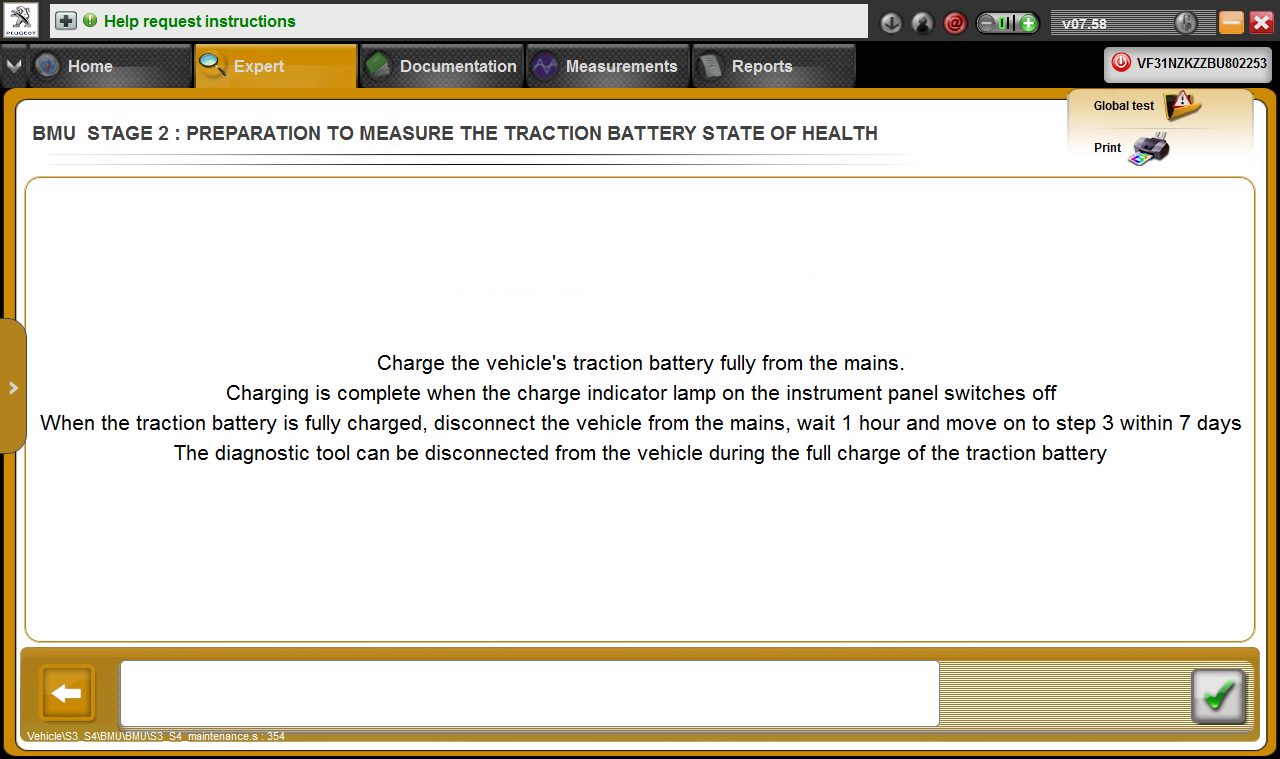
3) Continuing to the next step tells you to plug the car in and let it charge to 100%. Interestingly during this stage because the Ah figure is artificially low it actually charged to an indicated raw charge of 108% in Diagbox...

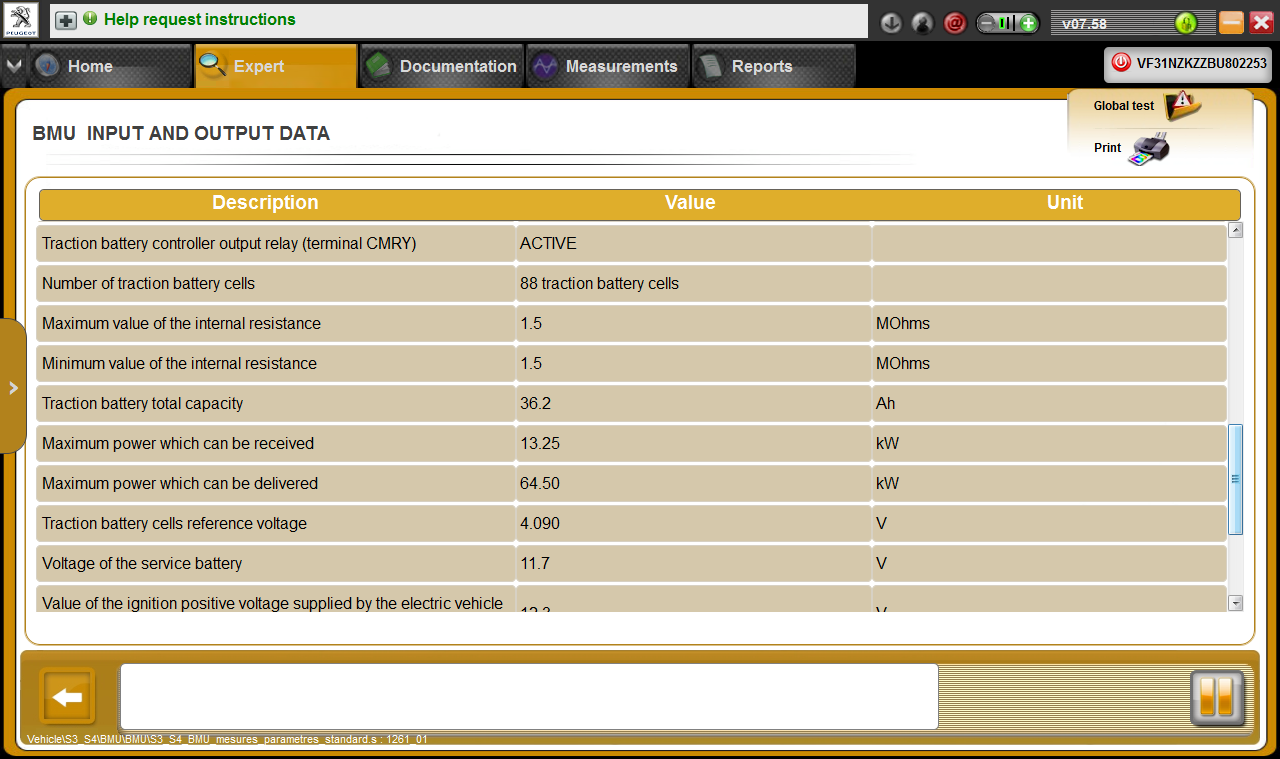
4) After it's fully charged you run step 3, and at that point (not before) the Ah figure and range remaining are updated - the Ah figure changed from 32.5Ah up to 36.2Ah, and RR changed from 56 miles to 62 miles. (Keeping in mind recent driving was fast driving to drain the battery quickly before the test)

Reported raw charge dropped from 108% to 98.5%, which is what it normally shows for a full charge.

So after this long drawn out calibration process I only succeeded in making the reading drop even further from 37.6Ah to 36.2Ah! :(

uc


At this point I thought I would disconnect the 12v battery for 10 minutes to reboot all the ECU's - this resulted in the range remaining figure going up from 62 miles to 67, however the Ah figure dropped a fraction to 36.1Ah. So I assume that all that changed with the 12v battery disconnected is that the "recent miles/kWh" estimate changed back to some default estimate that is higher than my recent fast driving.

If I plug the current 36.1Ah figure into my excel graph the situation looks a lot worse than before, and worryingly so:

uc


Something that has me puzzled is that the current Ah figure of 36.1Ah differs significantly from the saved test results from the battery calibration on the "capacity after maintenance" screen of the BMS, which appears to keep a permanent record of the results of the last several battery calibration maintenance sessions:

uc


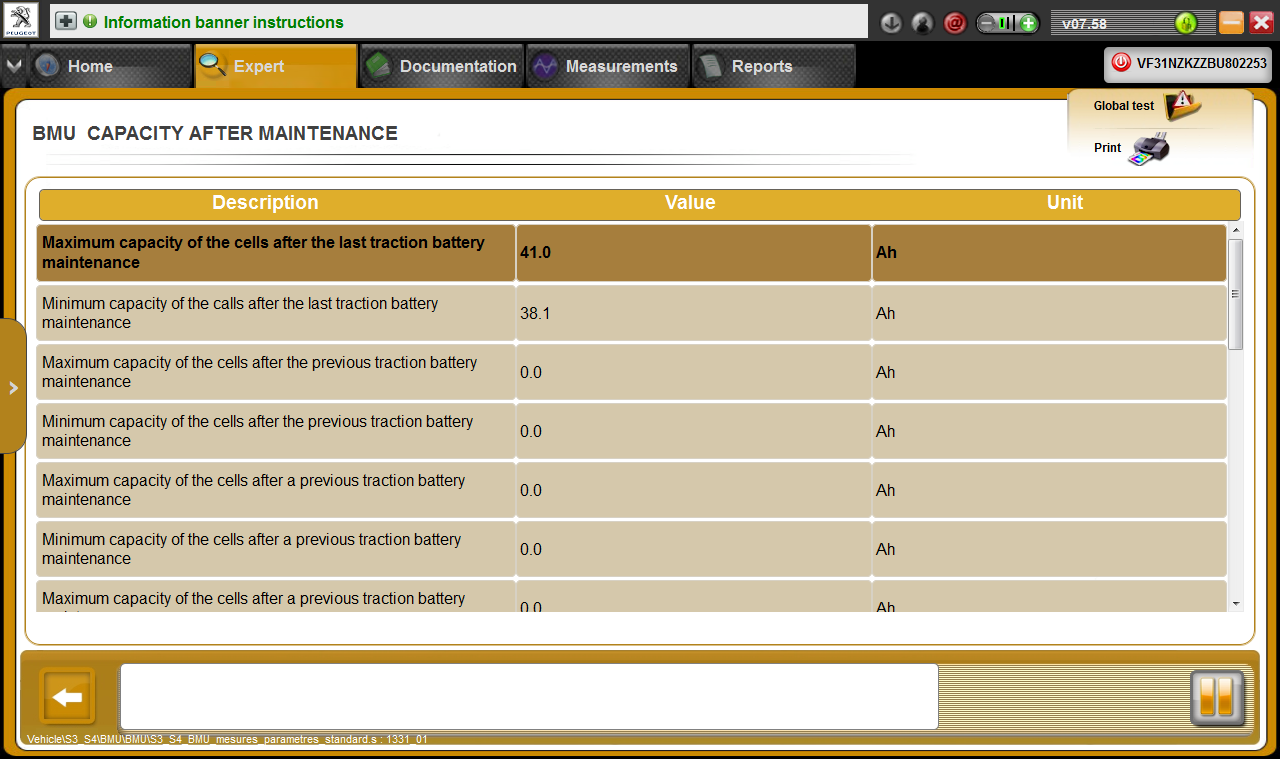
Two interesting things of note from this page - the first is that before I ran the calibration all fields were zero, which I think means that the dealer has never run a battery calibration in the life of the car, despite it apparently being part of the yearly or bi-yearly maintenance schedule... :roll:

The second is that if I read it right, it is saying that the result of the test is that the best cell has a capacity left of 41Ah and the worst 38.1Ah. Although 38.1Ah is still a bit lower than I would have liked to have seen from 38.9 in 3 months, it's a reasonable and believable figure. So how can the worst cell have measured 38.1Ah and yet the figure used in the BMS for range estimation is now 36.1Ah ?

Doesn't make any sense to me... :?

There is another section that purports to show the Ah capacity of every individual cell - which has always said 0 for all cells. I was hoping that the results of the calibration would appear here, but nope - the battery capacity of all the individual cells is still listed as 0 Ah... shame.

So do I have a faulty cell ? I've read most of the threads about people having faulty cells at around 40,000 miles, well guess what, mine seems to have suddenly lost capacity around 40k miles as well... And it looks like there might be an imbalance of one cell - but it will be hard to tell for sure until I have Canion monitoring as Diagbox is too clumsy to view the data in an easy to absorb graphical form and isn't usable while the car is driving.
 
Driving it fast, can you actually go 55 to 60 miles?

IMO, how far the car can go now vs how far it used to go is a better measure of the battery than any of the 'scientific' tests - Unless you've noticed a marked decrease in actual range, I wouldn't be too worried about it

Don
 
Don said:
Driving it fast, can you actually go 55 to 60 miles?
That's hard to answer, because I am still using some heater (but less than winter) however yesterday I did some motorway driving without the heater, dry roads, and about 12C outside, discharging the battery to about 30%. At the end of the trip distance covered + RR was only 53 miles. (RR was under 10 miles if I remember right) Speed was 55-70mph. I would have expected over 60 miles in those conditions based on last years driving.

I have noticed intermittent odd discrepancies in how much range I can achieve a few times now in the last couple of months - my daily commute is very consistent and I typically arrive with the same range left +/- a few miles, in winter with lots of heater it is about 6 miles left when I get home.

But there have been a few occasions where the battery seems to be running down a lot quicker than it should be - I put it down to a sticking brake, which I did have some issues with but now I'm not so sure. I'd notice that I've got to work with barely over half charge (normally I have 3 bars above half way even in winter with the heater on) then I've had to cut the heater down to a bare minimum on the way home and only just squeaked home with say 2 miles left with very little heater use. Then a couple of days later it will seem better again.
IMO, how far the car can go now vs how far it used to go is a better measure of the battery than any of the 'scientific' tests - Unless you've noticed a marked decrease in actual range, I wouldn't be too worried about it
If some other threads are to be believed, battery degradation - at least the first X percent degradation, is hidden in the turtle range. So you'll do the same range from full charge to flashing bars after you have some degradation, but the cell voltage will be much lower at this point than new and consequently turtle mode will have a lot less range.

So I don't think "actual range" is a good indicator if a lot of the loss only applies to how far you can go in turtle mode. In an emergency a few months ago I was able to do 5 miles in turtle mode at 20mph with no heater without running out, but I wouldn't like to be in the same situation today!
 
I'm sure you're correct that initial degradation (probably the first 15% or so) is pretty much hidden by how far the car will go after it reaches zero RR. I recall once early on when we went 6 miles at about 40 or 45 mph and got home without any sign of the car slowing down - No idea how much farther it would have gone at that point, but I suspect it would probably have done another 2 or 3 miles

But . . . . a car with 40,000 miles on it that can still go 50+ miles at 55 to 65 mph doesn't have a battery that's in too bad shape, IMO. You can probably still go 65 or 70 miles at 35 or 40 . . . . without the heater

I used to hope that one of our cars would have a failure about now - 6 years old - So we would have a new battery to last us another 8 or 10 years, but now I'm much less worried about it than I initially was. iMiEV batteries have held up much better than I would have expected when we bought ours new

Don
 
Don said:
But . . . . a car with 40,000 miles on it that can still go 50+ miles at 55 to 65 mph doesn't have a battery that's in too bad shape, IMO. You can probably still go 65 or 70 miles at 35 or 40 . . . . without the heater
I'm not saying that the condition of the battery right now is unusable or unreasonable for it's age, if it levels out where it is now it will be usable, my concern is the sudden apparent drop that does not follow the trend line established over the previous 9 months that I have been monitoring it. The precipitous drop is out of character for the car, and after reading many other threads here that started with similar concerns and ended up with a battery pack replacement under warranty due to a rapidly dying cell, I'm naturally quite concerned.

Especially when I still have 3 years of personal bank loan left to pay off the car - if it gets written off due to a faulty battery not covered under warranty I'm in the awkward position of either trying to source an individual cell and fit it myself (which I could do with access to a hoist, but it's a big project - I have the knowledge but not really the working facilities to do it) or having to continue paying for a car for several years that is now scrap and off the road... :(

The car theoretically has a battery warranty until June 2019, however I'm not sure what mileage the warranty is good for - I think it may only be 60k miles, and I will be pushing close to 60k miles by then. I also don't know whether excessive degradation is covered, (say 70%) or whether only outright cell failure or severe range or charging problems charging would be strong enough evidence to get a replacement. At the moment there are no obvious external signs on the dashboard or driving the car that I could point to when demonstrating an issue is occuring, and somehow I don't think Canion screen shots will cut it as evidence for such an expensive warranty replacement. In all likelihood there will have to be severe problems with range or issues charging before they would even consider a replacement.

I need to get some sort of written confirmation from Peugeot of the exact terms of the extended warranty before the situation goes too much further.

If the figures are to be believed it has just dropped from 84% SoH to 78% in 3 months after only dropping from 86% to 84% over the previous 9 months.

As far as I can see, there are three possible explanations for the sudden out of character drop in the reported Ah figure:

1) The battery has been degrading at this rate all along (for at least the 12 months I've had it) but the figure the diagnostic tool has been reporting has been somewhat optimistic "predicted degradation" rather than being based on actual measurements. The conditions necessary for accurately measuring the Ah capacity of the cells don't present themselves very often in an EV - in summer I typically never went below about 6-7 bars on my daily commute, which is not low enough to do a full battery calibration. So in absence of suitable measurement conditions the BMS must follow a pre-programmed battery degradation model that assumes the battery degrades at a certain rate per cycle, in given temperature conditions etc..

This would explain a very smooth linear degradation rate - which is in reality just what the BMS predicts from it's model, not what it actually measures. Then winter comes along and I am regularly getting down to 1-2 bars at the end of my commute - this is low enough to measure actual Ah capacity, however it's possible that it needs to see many instances of a lower than expected measured Ah figure before it will update the working figure.

In this scenario nothing has gone wrong with the battery since January, it's just that it was able to measure and realise that its estimation of Ah capacity was considerably higher than reality, so after a while confirming this, it made a step change in the reported figure. Had I run the diagnostic tool battery calibration before January it most likely would have dropped the Ah figure back then. This is probably the most benign of the three possibilities - the battery is OK but is degrading more quickly overall than predicted by the programmed in model in the BMS.

2) Something has happened in winter that has genuinely stressed the cells and caused accelerated degradation. The only thing I can think of is that I have been more or less forced to deeply discharge the battery on a daily basis through much of the winter. My commute is 38 miles and there is often no choice but to use the heater (I have a 2 year old in the car for example) but in the depth of winter this lead me to regularly arrive home with only 1-2 bars, and on occasions no bars. This is certainly not ideal for the battery and I wonder if this deep discharging has accelerated the degradation through the entire winter period, even though it only updated the Ah estimate between January and April.

One thing that suggests this may be true is that the "automatic" update which happened some time between January and April only dropped the figure from 38.9 to 37.6Ah, then running the battery calibration procedure has dropped it again from 37.6 to 36.1Ah - suggesting that further degradation has happened since the last update an unknown amount of time ago. If no further degradation had occurred since January I would have expected the battery calibration figure to come back around the same 37.6Ah figure.

3) An individual cell has developed a fault in the last few months, probably since January, and the reported gradual decline in Ah last year was in fact accurate and not an overestimation of the capacity. This weak cell has caused the reading to drop to 37.6Ah at first, and then on more recent testing it has dropped further to 36.1Ah. So in the best case scenario it has dropped by 1.5Ah in only 3 months.

The only way to confirm this will be to keep a close eye on the cell voltage graph on Canion as the battery is charged and discharged to see if a pattern forms similar to what others with failing cells have observed, and to see whether the imbalance when discharged gets worse from week to week.

So I will keep a close eye on this and also take a diagnostic tool Ah reading once a week for the next few weeks to see if there is any further decline. (I'm not going to run another battery calibration though - I'll just let it do its thing automatically) Last year I saw at most 0.1Ah decline in a calendar month, and as 0.1 is the minimum step in the readout in theory I should not see a decline more than once a month. If I see a drop every week I'll have something to worry about I think.
I used to hope that one of our cars would have a failure about now - 6 years old - So we would have a new battery to last us another 8 or 10 years, but now I'm much less worried about it than I initially was. iMiEV batteries have held up much better than I would have expected when we bought ours new
I used to think the same too - I read all the forum reports before buying mine that showed almost nobody had any problems with cells, and mine seemed to be better than average up until January. However I'm now quite worried, especially after reading so many reports on this forum of a single failing cell at around 40k miles - and sure enough, at 40k miles i'm now starting to see very suspicious changes in Ah. :(

Keep in mind that my car is a 2011 - which means it has the older LEV50 cells, not the newer LEV50N from 2012 on which supposedly degrade at a much lower rate.
 
DBMandrake said:
The car theoretically has a battery warranty until June 2019, however I'm not sure what mileage the warranty is good for - I think it may only be 60k miles, and I will be pushing close to 60k miles by then. I also don't know whether excessive degradation is covered, (say 70%) or whether only outright cell failure or severe range or charging problems charging would be strong enough evidence to get a replacement. At the moment there are no obvious external signs on the dashboard or driving the car that I could point to when demonstrating an issue is occuring, and somehow I don't think Canion screen shots will cut it as evidence for such an expensive warranty replacement. In all likelihood there will have to be severe problems with range or issues charging before they would even consider a replacement.

On the current Peugeot website, it says the traction battery warranty is 8 years / 60,000 miles. I asked Peugeot via the feedback form whether that applied to all iOns as they implied - this is the question I asked:

----------------------------------------------------------------------
In the “Price, equipment and technical specifications” document for the Peugeot iOn on your website, it states the following:
“Traction Battery Warranty
All Peugeot iOn cars first registered in the UK and purchased from a UK Peugeot Dealer benefit from a Peugeot 8 year / 60,000 mile manufacturer traction battery warranty”
Does this mean that this warranty applies to older Peugeot iOns that were first registered in the UK and purchased from a UK Peugeot dealer - for example a 2013 Peugeot iOn?
----------------------------------------------------------------------

and this is the reply I was given:

----------------------------------------------------------------------
Thank you for your recent email about traction battery warranty on a Peugeot iOn.
On a 2013 Peugeot iOn the manufacturer traction battery warranty would be 8 years/ 60,000 miles.
If you do need anything else, please feel free to get in touch on the number below.
Thanks again for contacting Peugeot customer care.
Kind regards
----------------------------------------------------------------------

I haven't (yet) asked what the actual warranty terms and conditions are - I guess I should have a copy of it somewhere - I will have a look when I get the chance.
 
My OBDLink LX arrived today so at lunchtime I popped out to the car to plug it in and it worked straight away. :)

The 36.1Ah capacity figure appeared straight away, so perhaps the car broadcasts this figure when the key is first turned on as I had Canion already running before turning on the key. (Others have reported the Ah figure only first shows up when reaching a full charge during charging)

The car is still at 72% charge at the moment, but all cells are within +/- 5mV of each other with about 11 cells +5mV and 4 cells -5mV from the average, which all looks pretty normal.

Of course a weak cell will tend to show up at the bottom end when the cells are discharged below about 30% so I'll check again tonight after I get home and if necessary run the battery down a bit further than usual to provoke it.

I'm crossing my fingers that there isn't an individual weak cell, I suspect theory 1 (nothing wrong with the battery but the Ah figure last year was an over optimistic prediction not actually measured) may be the truth but it's too early to say yet.

I got to work with some heater use and 12 bars (72.5% according to Canion) left which is pretty good - better than average, although a couple of detours that have been on my route for the last two weeks are now gone so it's hard to be certain. Watch this space!

Would still like to get an official letterhead letter from Peugeot spelling out exactly what the battery (and drivetrain?) warranty covers though.
 
DBMandrake, thanks for posting your details.

Warranty questions aside, at least the initial readings by CaniOn look very good. As you pointed out, lower down the SoC is where we'd expect issues, if any. I haven't checked mine down there for a long time. After you fully fully charge the car and it does its balancing you should find all the cell readings identical.

Let us know how things progress, and good luck. 36Ah is still a very usable capacity and I'd only be worried if one or more cells were significantly out of line.
 
I've managed to record some cell readouts yesterday at 71%, 10% (turtle just appearing) and just this once, I let it drain right down to 0% on the driveway until it actually shut off, to see what the cutoff voltage was.

uc


uc


uc


At 71% the maximum difference is 10mV, by the time I get down to turtle mode (10%) the difference is 50mV and you can see a couple of cells that are a little bit weaker than the others, and at 0% it had increased to 120mV, although that is an extremely harsh test that I won't be repeating again...

Cutoff voltage of the lowest cell when the READY light went off was 3.56 volts with a pack voltage of 320 volts.

How does this look to other people relative to their own measurements ? Cells 25 and 70 are a bit weaker than the others but not exceptionally so given that I tested them right down at 10% - from what I remember you don't see them start to diverge from the rest until getting down to about 30%. I guess these two weaker cells are responsible for the Diagbox battery calibration report saying the best cells had a capacity of 41Ah and the worst 38.1Ah, or about 3Ah less.

Also perhaps the 36.1Ah "usable" figure reported is only from 100% down to RR --- or turtle ?
 
I had a lot of trouble with my OBDLink LX dropping the bluetooth connection by the way - it would work for a random amount of time from a few minutes up to 20 minutes or so before the fps figure would drop to 0 and the adaptor would "lose" pairing to the tablet. (Amazon Fire HD 8)

When this happened the android notification bar would keep reporting "Pairing request, Touch to pair with OBDLink LX", but it would only appear for a second then disappear. If I did manage to touch it it would show a pin number but then usually say it failed due to an incorrect pin before I could even hit pair! Once it got into this state I had to unplug it from the car and manually re-pair it. Very frustrating.

This morning I've managed after a lot of struggling to get the firmware on the adaptor updated to 4.3.0 (the windows firmware updater just crashes for me, and I had difficulty with the OBDLink android app as well) and interestingly the previous reported firmware version was 0.0.0 !

I've noticed some change in the behaviour of the lights on the adaptor when connecting and disconnecting so there is definitely a change in the firmware version since the update, and it seems to connect OK afterwards, however I have not driven the car yet since the update to see whether it still drops out. Fingers crossed the firmware update helps as the connection was very flakey for an expensive, branded adaptor - I left it on to record my charging session last night but the bluetooth pairing dropped out in less than 20 minutes!
 
That's interesting test data, thanks for sharing.

From what little data we can find on the cells, 4.2 V is 100% and they consider drained to 0% at 2.75 V when making cell meaurements at Yuasa.

We don't really know how the car measures and reports battery capacity versus the yuasa procedure, and there are many variables such as discharge rate and temperature to consider in that calculation.

For some reason 25 and 70 are your weaker cells and hopefully they come back up with all the rest after charging and balancing.
 
kiev said:
From what little data we can find on the cells, 4.2 V is 100% and they consider drained to 0% at 2.75 V when making cell meaurements at Yuasa.
That's what I've thought for a long time as well but I happened on this technical article from Yuasa just today that seems to imply that the 50Ah capacity is measurable from 4.1v to 2.75v not from 4.2v to 2.75v as we first thought. That extra 0.1v makes quite a difference at the top, as it represents nearly 10% of the cells capacity:

https://www.gs-yuasa.com/en/technic/vol5/pdf/05_1_021.pdf

Note in particular figures 2 and 3 which explicitly say discharging from 4.1v to 2.75v and if you look at the graph they're hitting 50Ah at warmer temperatures and lighter loads. (10A)

In fact there is no mention of 4.2v anywhere in the article.
We don't really know how the car measures and reports battery capacity versus the yuasa procedure, and there are many variables such as discharge rate and temperature to consider in that calculation.
Indeed. The discharge to 0% SOC was partly to try to figure these things out.

I now know for example that the turtle came on at almost exactly 10% SoC, (dashed lines for RR was about 12.5% but I forgot to note it exactly) which based on a usable battery capacity of about 12kWh after degradation to 36Ah is a good 6 miles or so of careful driving at 30mph assuming 6 miles/kWh. (which I seem to be getting at 30mph according to Canion)

This ties in with my one on-road encounter with the turtle where I was forced to creep nearly 5 miles in turtle mode at 20mph and made it to the charger without running out after strongly doubting it would go that far.

Also it looks like the pack shuts down at exactly 320 volts total pack voltage even though the lowest cell was still at a very safe 3.56 volts, certainly a long way above the minimum 2.75v specified in the Yuasa document. So whilst repeatedly discharging this deeply is not a good idea of course, the voltage is not low enough to do any real damage to the cells during a single deep discharge.

I presume as well as a 320 volt cutoff it would also cut off if any individual cell got below a certain, lower threshold, although I don't know what that lower threshold might be and I'm not planning to find out!

3.5v is on the "knee" of the discharge curve at a 10A rate on figure 2, it looks like there is only about 5-10% of raw capacity left between 3.5v and 2.75v so I guess they just decided to stay away from that very low voltage range or keep it as a buffer so that the loaded cell voltage when accelerating stays above 2.75v.
For some reason 25 and 70 are your weaker cells and hopefully they come back up with all the rest after charging and balancing.
They are well balanced in the top half of the SoC range, so I think it's a relatively minor imbalance - the voltage drops very quickly in the lowest 20% SoC so any minor variations between the cells will be greatly magnified at such a low SoC. In fact at 71% the two cells in question show a higher voltage than the others.

So while there is an imbalance it's only visible at relatively low SoC and doesn't look like anything serious, certainly nothing like what I have seen in other posts here... Phew!
 
See this topic and links therein also: http://www.myimiev.com/forum/viewtopic.php?f=5&t=3782&p=33402&hilit=yuasa#p33402
 
I dont disagree with the data, but seems unlikely that two cells would weaken at the same time... though I do understand your concerns. I would want to do the cell balancing procedure and repeat this test a couple more times and keep an eye on those two cells.

I checked my 2012 car recently at 100% over a fairly cold month, and was at 42.3 at 100% SOC with 17K on the clock... so it sort of tallies.

Only other thing to say is that if the X axis on your initial chart began at 0, then the recent degradation wouldnt look anything like as pronounced, as we are looking at a heavily truncated axis..

How did you get the car down to 0% SOC... was this by using the heater to drain it out... if you did do that, I wonder if that could have put a large drain at a low SOC to begin with and resulted in the data you see. Certainly a a few balancing cycles and steady discharges may help to identify how repeatable this all is.

Other forum users have reported rapid SOC degradation and RR going to a few bars after about 25 miles or so, with a very significant SOC drop on a single cell, which doesnt seem to be the case here.

I assume your charging practices are fairly typical?

Ben
 
Phximiev said:
See this topic and links therein also: http://www.myimiev.com/forum/viewtopic.php?f=5&t=3782&p=33402&hilit=yuasa#p33402
I read that thread but I'm not sure what part of it you're drawing my attention to or how it relates to my problem ?
 
phb10186 said:
I dont disagree with the data, but seems unlikely that two cells would weaken at the same time... though I do understand your concerns. I would want to do the cell balancing procedure and repeat this test a couple more times and keep an eye on those two cells.
What "cell balancing procedure" are you referring to ? The car gets a 100% Level 2 charge each night, so the cells are always balanced every morning. I've heard of a cell balancing maintenance procedure in the MUT tester (which I assume is used to get initially very out of balance cells back into balance for example after a single cell replacement) however I couldn't find any equivalent action in PSA's Diagbox.
I checked my 2012 car recently at 100% over a fairly cold month, and was at 42.3 at 100% SOC with 17K on the clock... so it sort of tallies.

Only other thing to say is that if the X axis on your initial chart began at 0, then the recent degradation wouldnt look anything like as pronounced, as we are looking at a heavily truncated axis..
The auto scaling axis is on purpose - I would never be able to see any small variations between summer and winter degradation if the Y axis went all the way to 0. In relation to the previous results I don't think it's misleading.
How did you get the car down to 0% SOC... was this by using the heater to drain it out... if you did do that, I wonder if that could have put a large drain at a low SOC to begin with and resulted in the data you see.
You can't use the heater to get down to 0% SoC. Both the heater and AC are disabled as soon as turtle mode activates at 10%. So I left it in gear with the hand brake on so that the motor is producing a small amount of creep torque. Total power consumption during this according to Canion is about 1.2kW, of which 0.3kW is fixed overheads even with the car in neutral. It took a long time (a couple of hours) to discharge the last 10%. So this is a relatively light discharge compared to the 5kW peak of the heater.
Certainly a a few balancing cycles and steady discharges may help to identify how repeatable this all is.
As mentioned, the car charges to 100% every night so starts the day perfectly balance. (Confirmed by Canion)

I took some further measurements yesterday and the trend looks the same - above about 50% there is no apparent imbalance, by the time you get down to 30% or so cells 25 and 70 are slightly lower but I think it might just be normal manufacturing tolerance variations, for all I know these two might have been slightly weaker from new. But it is consistent day to day:

uc


uc


uc


The RR figure is still unusually low on a full charge - 53 miles this morning compared to 67 after a 12v battery disconnect, but I think that's because I drove like I stole in the day before to run the battery down to 10% quickly for the purposes of testing the low end discharge.

The GOM seems to take a long time to "forgive" you after doing that, and remains very pessimistic for days, even though my consumption since then has been conservative.

I did a few sums today based on my morning drive to work, using Canion figures.

No heater use, 17.3 miles over 41:38 minutes driving, average speed 25mph, (mixed 30mph and 50-60mph motorway) my average Miles/kWh was 5.2 (higher than I expected) with 18% Wh regen, and I arrived with SoC at 75%.

By simply multiplying the distance by 4 I get 69.2 miles which at that consumption rate I could theoretically do from 100% to dead. Of course I wouldn't want to go into turtle mode, which starts at 10% so if we take off 10% we get 62.3 miles range from 100% charge to turtle mode at 5.2 miles/kWh.

Average battery voltage over most of the journey is about 340 volts, times 36.1Ah gives 12.3kWh usable, at 5.2 miles/kWh that is 63.8 miles, so I guess it all tallies up, with the 100% charge RR estimation being based on discharging only until the beginning of turtle mode or about 10%. (Or perhaps until the range figure disappears which is about 12.5%)

So I perhaps don't have anything to worry about if it doesn't degrade significantly further in the next few months. I still have 14 months of battery warranty left so you can bet I'll be keeping an eye on this.
 
DBMandrake, thank you for posting those images and analyses, and thanks for stress-testing your battery in the interest of science. My impression is that your battery is just fine and does not exhibit the dramatic individual cell failure which some of us have experienced (and which was cause for battery replacement by Mitsubishi).

Yes, balancing is merely charging to 100% and letting the system hold its course until it stops charging. Recognizing that the individual cell balancing current is very low, on the Australian forum, IIRC, one owner's repeated such charging brought back a recalcitrant pack.

For myself, I've never seen turtle and keep the pack between four bars and twelve bars, only charging to 100% (and allowing it to 'balance') just before the occasional long trip. My hope is that such behavior will result in a long-lived pack.

Incidentally the "GOM" (Guess-O-Meter) expression common on the Leaf forum does not apply to our i-MiEV: our RR (Range Remaining) is very predictable and is a simple algorithm which is a moving average of the car's consumption in the preceding 15 miles (24km). Even though the RR is offset by, for example, 20% whenever the heater is turned on, as best we can tell this does not factor into the RR past consumption equation. It is predictable because we know the type of terrain, wind, and type of driving we had experienced and can mentally compensate for any changes in these conditions.

The last thing to stress is that whenever we talk about energy consumption we must distinguish between wall-to-wheels (which some of us had laboriously calculated) and battery-to-wheels which many cars show on their dashboard and we have see on CaniOn. My personal figure-of-merit (efficiency target) for the i-MiEV is 100Wh/km as shown on CaniOn, but I use the wall-to-wheels number of 4.2mi/KWh (meticulously measured over 8000miles) for any calculations.
 
JoeS said:
DBMandrake, thank you for posting those images and analyses, and thanks for stress-testing your battery in the interest of science. My impression is that your battery is just fine and does not exhibit the dramatic individual cell failure which some of us have experienced (and which was cause for battery replacement by Mitsubishi).
I think you're right - at least at this point there is no obvious individual cell failure. I guess I just have to come to terms with the likelihood that the battery has been 36.1Ah for some time, perhaps even since before I bought the car but the BMS has been providing a "predicted" figure with a predicted linear degradation providing figures which were considerably higher than the "true" state of the battery, which was not revealed until a full calibration was run. Perhaps this diagnostic tool calibration should be run once a year to ensure the true state of the battery is known and that we're not buying into the BMS's delusion...

I won't know for sure until summer but I suspect that my full charge no heater range will be fairly similar to last summer. Fingers crossed.
Incidentally the "GOM" (Guess-O-Meter) expression common on the Leaf forum does not apply to our i-MiEV: our RR (Range Remaining) is very predictable and is a simple algorithm which is a moving average of the car's consumption in the preceding 15 miles (24km). Even though the RR is offset by, for example, 20% whenever the heater is turned on, as best we can tell this does not factor into the RR past consumption equation. It is predictable because we know the type of terrain, wind, and type of driving we had experienced and can mentally compensate for any changes in these conditions.
If only it were that simple... :twisted:

Yes, the consumption caused by the heater and AC is added on "afterwards" and does not factor into the miles/kWh average that it uses to calculate the base figure (at least as far as I can tell) and yes, while driving it does appear to average your miles/kWh consumption over approximately 15 miles. (Although it seems less than that to me, more like 5 miles)

However.... there is something special about the RR reported after completing a 100% charge that is definitely not just the average of the last 15 miles completed before charging.

Because I often get wildly varying RR on full charge from the exact same work commute with about the same actual consumption. (Judged by the number of bars left when getting home being the same)

At the moment I am seeing a full charge RR of only 53 miles, two full days after driving the car fast, and yet over the first 8 miles of driving the figure actually goes up from 54 to 56, indicating the true figure of distance driven plus range remaining is about 62 miles, which would be about right.

And despite maintaining an average consumption to give 62 miles per charge, the next day I will get an underestimated RR at full charge of 52, which will again go up as I drive.

Conversely I often see a RR on full charge of between 75 and 84 (!) miles despite following the exact same driving pattern, in this case the RR drops rapidly over the first 5-10 miles of driving.

So in my experience the RR figure after completing a full charge is highly unstable and untrustworthy, with figures anywhere from about 50 miles to 84 miles with pretty much identical driving. Only after I have done about 10 miles will I start to trust the RR figure and by the time the battery is down to below 50% it is very accurate.

What's going on to cause this ? I'm not sure. But one thing I'm certain about is it's not just using the average of the last 15 miles driving before charging. It's simply not possible for it to give these kind of figures with my regular commute. I'm still trying to find a correlation to explain where it gets its bizarre full charge RR figures from.
The last thing to stress is that whenever we talk about energy consumption we must distinguish between wall-to-wheels (which some of us had laboriously calculated) and battery-to-wheels which many cars show on their dashboard and we have see on CaniOn. My personal figure-of-merit (efficiency target) for the i-MiEV is 100Wh/km as shown on CaniOn, but I use the wall-to-wheels number of 4.2mi/KWh (meticulously measured over 8000miles) for any calculations.
Yep, I'm well aware of the difference between wall to wheel and battery to wheel.

Prior to getting Canion all my readings were wall to wheel, and that is what matters for working out charging costs and times.

However battery to wheel is what counts for working out driveable range from battery capacity, hence using those figures for the recent calculations.

However to get from 5.3 miles/kWh battery to wheel to 4.2 miles/kWh wall to wheel would imply a charging efficiency of only 80%, which seems a bit on the low side to me. I have a DIN kWh meter in my charge point so I could do a direct comparison between I charge at the wall to the reported figure on Canion to estimate the charging efficiency.


However I think Canion's estimation of current and power at very low powers (like when stationary) is significantly out.

For example it tells me that there is 0.3kW being used from the traction battery when the key is turned on but the car is not in READY mode - which is completely impossible as the contactors are open in this state isolating the battery from the rest of the car! So something is not right with the low power measurements provided by Canion. :lol:
 
DBMandrake, I think we're on the same page and perhaps with your permission I might move this efficiency discussion to a separate thread if you wish to continue it - finding these conversations within mis-titled threads in the future is difficult.

My RR always goes up after leaving home: I live up a hill! On the flatlands, especially after a full charge, I can make RR go up or down at will.

The first (16th) bar always takes more driven miles than the rest to drop from 16 to 15. Conversely, at the bottom end, the perception (anxiety-induced?, but unproven) is that the last couple of bars drop faster for miles driven.

I challenge anyone (and I'll put money on it) to predict what their RR will be after their car completes charging! The variability in our driving and our environment is such that I believe this number cannot be precisely predicted. Despite my leadfoot-driving full-charge RR normally in the 50's and 60's, I can still easily achieve a number over 80 after hypermiling.
 
DBMandrake said:
phb10186 said:
I dont disagree with the data, but seems unlikely that two cells would weaken at the same time... though I do understand your concerns. I would want to do the cell balancing procedure and repeat this test a couple more times and keep an eye on those two cells.
What "cell balancing procedure" are you referring to ? The car gets a 100% Level 2 charge each night, so the cells are always balanced every morning.

So - based on the last part of my reply about how you may charge, I would charge from 2-3 bars and leave it overnight until it is fully charged and the charge indicator goes off - and I would cycle the pack a half dozen times in this way. I would also perform a 12v battery pull and leave it for an hour disconnected when you can.

Lastly, just to eliminate any possible incling of 12v battery issues, I would test that as well.
 
Back
Top