Benchmarking to measure capacity loss

Mitsubishi i-MiEV Forum

Help Support Mitsubishi i-MiEV Forum:

This site may earn a commission from merchant affiliate links, including eBay, Amazon, and others.

suradasa

Member
Joined
Nov 15, 2013
Messages
7
Location
Ottawa, ON
Hi there.

I figured that the best way to measure capacity loss over time is to measure how many kWh I'm putting into the battery per bar. Then I can track how it changes over time.

I've done it twice so far to benchmark the initial state, but the two numbers are farther apart than I would have expected:

1) Charged from just below 2 bars to just above 12 bars (L1, had to go to work). I guesstimated that I put about 10.1-10.2 bars in, measured 10.87 kWh --> 1.065-1.075 kWh/bar
2) Charged from almost exactly 7 bars to full. So about 9 bars in, measured 10.28 kWh --> 1.14 kWh/bar

So that's 7-ish% difference. Any thoughts? Maybe the bar readings aren't very precise? Obviously, charging from near-zero to full would be ideal for this, but I try not to fully discharge it (and it takes a long time).

I can just take a bunch of readings over time and see what happens, but curious to see what people think.

Surdas
 
suradasa said:
Hi there.

I figured that the best way to measure capacity loss over time is to measure how many kWh I'm putting into the battery per bar. Then I can track how it changes over time.

I've done it twice so far to benchmark the initial state, but the two numbers are farther apart than I would have expected:

1) Charged from just below 2 bars to just above 12 bars (L1, had to go to work). I guesstimated that I put about 10.1-10.2 bars in, measured 10.87 kWh --> 1.065-1.075 kWh/bar
2) Charged from almost exactly 7 bars to full. So about 9 bars in, measured 10.28 kWh --> 1.14 kWh/bar

So that's 7-ish% difference. Any thoughts? Maybe the bar readings aren't very precise? Obviously, charging from near-zero to full would be ideal for this, but I try not to fully discharge it (and it takes a long time).

I can just take a bunch of readings over time and see what happens, but curious to see what people think.

Surdas
I think we can't measure capacity loss that way. With 11 bars, SoC can be 85,5% to 92,5%. But other bars just correspond to 5% of SoC. The only way is to measure what it takes from don´t running to full (turtle is from 5,5% to 10,5%).

Bar 16 92.5-100% 7.5%
Bar 15 >=85.5% 7%
Bar 14 >=80.5% 5%
Bar 13 >=75.5% 5%
Bar 12 >=70.5% 5%
Bar 11 >=65.5% 5%
Bar 10 >=60.5% 5%
Bar 9 >=55.5% 5%
Bar 8 >=50.5% 5%
Bar 7 >=45.5% 5%
Bar 6 >=40.5% 5%
Bar 5 >=34.5% 6%
Bar 4 >=28.5% 6%
Bar 3 >=22.5% 6%
Bar 2 >=17.5% 5%
Bar 1 >=12.5% 5%
Without bars <=12.0%
Turtle <=10.5%
Don´t run <=5.5%

Discharging the battery to 5,5% will not be good for the battery health, so we should avoid it. Sincerely, for now, i don't see how we can measure battery degradation.
 
You can't measure anything if you're basing the SOC on the bars on the fuel gauge as a basis for how 'full' your battery is when you begin charging

You can do it a hundred times and get numbers all over the place (as you already found out) and when you average all those numbers, you still don't have an accurate number that you could base an accurate measurement on

Don
 
Sadly, over 20,000 i-MiEV's (or rebranded i-MiEV's) have been sold worldwide and we do not have any information on the remaining battery capacity or how to check it.
 
In fact, there is quite an easy way to measure capacity and it's loss. If all cells are healthy, balanced, then measuring the amount of electricity used to charge from 0 to 100 % SOC is reliable enough method for determining battery pack capacity change. The more individual cells are damaged, lower is the accuracy. Only measuring of internal electrical resistance of all cells is better method. It can be done only with professional tools.

To compare and determine the percentage reduction in capacity is necessary to know how many kWh from the wall a new battery can "eat"(benchmark). I did such measurement last year with new test car and with my own: it was 18.4 kWh used to charge dead battery (car not moving) to full.

Since excessive discharge is not recommended, it's better to charge for example from 0km RR (---) to a fully charged battery to be taken for the benchmark. We should fill to 100% SOC every 15 days anyway. If before this charging the battery is emptied till --- occurs and than charge to 100%, then we have the information we can compare with each other.

In the table to compare our mileage I added this coloumn at the end. If we regularly enter this data, we should see this number decreasing over the years and accordingly the average range of the car.

Of course, I could be wrong. That's why I asked for an opinion local EV experts most practiced in this area that I know. They confirmed my thinking.
 
Zelenec, theoretically you are correct. Practically, you will find very few people willing to 1) excessively deplete their battery pack and 2) perform the required kWh measurement. I have very accurate measurements of my input energy for over 8000 miles http://myimiev.com/forum/viewtopic.php?p=5744#p5744 (which is irrelevant to this topic), but will never allow my iMiEV to drop down to zero bars if I can help it.

The question of how Mitsubishi performs a capacity test with their MUT3 has never been answered.

Having CaniON introduces some more questions; for example, how is the CaniON SOC calculated, and could that somehow be used to determine battery pack kWh capacity? For example, if we start charging with a known CaniON SOC and stop charging with a known CaniON SOC and measure the kWh and voltage and current from the source, can we use these numbers to establish a baseline? Remember, using a 120vac charging voltage takes longer than 240vac and yet the fixed charger losses are constant (actually, a bit higher than 240vac), so the total kWh out of the wall would be measurably higher at 120vac for a given kWh put into the battery.

The good news is that a sick battery has been shown to be unable to be charged up to 16 bars. We have only two instances on this forum where that has occurred, which, again, to me is encouraging as to how good the batteries are at this point in time.

More questions than answers, but it sure would be nice to be able to establish a battery-capacity baseline without stressing the battery pack.
 
JoeS said:
....Having CaniON introduces some more questions; for example, how is the CaniON SOC calculated....
Bonjour Joe
I have one answer for you: the SoC you can see with canion is not "calculated", it is just a value we can observe on the canbus.
we get the SoC from pid 374, sent 10 times/sec. (in the second byte. formula is: B_SoC = (BB(1) - 10)/2 )

There is a fact: it matches exactly what you get from the "service tool" (mut3 or the one from peugeot).

So THE question could be : how is the mut3's SOC calculated....

Xavier
 
Zelenec said:
Since excessive discharge is not recommended, it's better to charge for example from 0km RR (---) to a fully charged battery to be taken for the benchmark.
I think that using any number on the RR gauge (even zero) would be even less reliable than using the bars on the fuel gauge because RR numbers are a calculation based on how you drove the previous 15 miles or so - That would determine where zero occurs more than a consistent SOC number I think - But Canion would easily prove or disprove that assumption

Like Joe though, I would NEVER want to discharge my pack to zero RR just to test it

I think the 'best test' would be using the Canion. Discharge the pack down to some nice even voltage which would represent about 1/3 SOC and measure the amps to fully recharge from there. Do that once every 6 or 8 months and keep a record. You're not harming the battery and you'd be using a repeatable fixed number for the start of your recharge so any difference in charge amp hours should be an indication of the degradation of the pack

Don
 
So, i´m the one from the future.

Yes, my i-MiEV just charges 15 bars when cells are very good balanced (most of the time they are unbalanced, because i not always charge to 100%, many times i don't discharge more then 30%, and my inner cells are usually significantly hotter). Just 15 bars (91% of SoC). But taking the charging pistol and letting it stand still for sometime, sixteen bar appears (my i-MiEV recalculates SoC to 100% after sometime). It's an i-MiEV with 9% battery degradation, a Portuguese i-MiEV, and is in much better shape then the Portuguese Nissan Leaf with the same age, because the majority of them have more then 17% of battery degradation. If i can confirm the 9% value, i don't know other Portuguese EV (and i know a lot) from 2011 and with 23000 miles in better shape, by far.

"For example, if we start charging with a known CaniON SOC and stop charging with a known CaniON SOC and measure the kWh and voltage and current from the source, can we use these numbers to establish a baseline?" JoeS, i think this will not work. When my i-MiEV was new, the sixth bar tooked just a little less of 1 kW.h from the wall. Now it just takes exactly the same. But in the end, sixteen bar is not there anymore.

When it recalculates to 100% and shows the sixteen bar, then when i stop for one hour after going to 60% of SoC, one bar simply vanish. I stop with 9 bars, and when i start the car again, after one hour (maybe a little more), there are just eight. 5% of SoC disappears (canion readings).

Yes, i'm showing you the future, because my i-MiEV is older, has more mileage, and lives in a hotter country.

Just telling you what i think is happening with my i-MiEV. I can be wrong. Everyday i change my ideas about the car. I´m ahead of you all. 9% of degradation, and the clock keeps going. We can't stop it, just slow it, and higher temperatures accelerate time, so, if you want them to last (the cells), just keep them cold, nothing else meters, just keep them cold. If it was a Norwegian i-MiEV, there was no i-MiEV Malm´s story.
 
I suspect that any measurement that depends on reading a voltage repeatedly would be inaccurate because of the dependency of voltage and probably capacity on temperature. So one would need to repeat the voltage measurement at exactly the same battery temperature which would be difficult to do.

The MUT3 is able to compute a capacity somehow. Maybe its calculation factors in temperature as well. Whatever it's doing, the information it uses must be available on the CAN bus, so CaniON should theoretically be able to compute capacity if we knew how the MUT3 does it.
 
bonjour, Xavier. Thank you for explaining the details of CaniON and the fact that in this case it is reading whatever the CANbus SoC is transmitting.

Malm, there is an American expression: canary in the coalmine - you are indeed our future predictor. Not too bad, as I see it, especially recognizing that Mitsubishi has warranteed the US batteries for 8 years or 80,000miles (128.748km) and that ours are probably two years more mature than yours.

Regarding temperature - there are two issues:

1) Voltage measurements at different temperatures: so far, the Lithium-based batteries are very unlike lead-acid. There appears to be little voltage variation due to temperature for any given SOC; nevertheless, there is a significant capacity degradation due to lower temperatures which gets us into the distinction between Depth-of-Discharge (Ah) vs. SoC(%) - let's not go there. I will be interested in seeing what our cold-weather-friends with CaniON can tell us regarding SoC and what it measures vs. voltage now that winter is here.

2) Battery life - yes, progressively higher-than-ambient temperatures are not good. 'nuff said.

I have six Lithium (NMC) packs from EnerDel that I use in one of my Sparrows and the manufacturer provided very exact voltage vs. SoC numbers both when charging and discharging. Amazing consistency and I now swear that, despite the shallow slope of the curve, simply measuring voltage is a great poorman's SoC meter with Lithium, usable from about 10%-90% SoC (I don't go outside those limits, anyway).
 
Zelenec has said in another post:

Zelenec said:
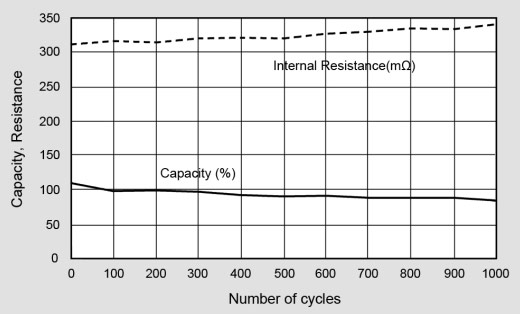
I spoke yesterday with an expert of Metron Institute Team. He said the only reliable and accurate method is measuring of internal electrical resistance of each cell. I just don't know if such data is sensored in the battery pack and transmitted through CAN port. If so, maybe priusfan will be able to include it someday in Canion.

Battery University seems to point in same direction

cycle4.jpg


If that "internal resistance" data of each cell is not transmitted through the CAN bus, perhaps could be calculated indirectly through the old Ohm's law (voltage variations in each cell with the same current flowing through all)
 
In re-reading this thread, I believe that there is still no consensus about the proper technique for measuring our i-MiEV battery capacity (please correct me if I am wrong), especially a technique that does not entail full discharge (which most of us are loathe to do). The following was taken from the CaniOn thread:
Malm said:
And updated to Canion 117. I will keep waiting to see in Canion the Battery Current Capacity. I know now that in march, in my i-MiEV, it was 36,4 Ah. I would like very much just to see if this value changes day by day. And if it changes, how it changes. And a graph with temperatures variation. Higher temperatures means higher degradation, and i'm following closely the temperatures, summer is coming :cry:. Canion is simply fabulous. With it, i can arrive home now with turtle and still know that have enough energy to take the car to the local supermarket. All the way, 2 miles, showing turtle and a smile in my face. With voltage over 3,5 V in the weakest cell, i don't see any problem in going to 0,0% SoC. Just seeing how i-MiEV is so unaware in getting SoC.
I extracted the above quote from the CaniOn thread as I would prefer for that thread to dwell on CaniOn and any battery discussions to be kept separate.

Malm, I'm confused: as best I can tell you are the only person on this forum who is experiencing battery capacity loss and and actually quantifying this. We've had this discussion before on the Future Battery Replacement thread. Perhaps it would be worthwhile repeating the exact details of how you are presently measuring your battery capacity so that we can arrive at a consensus that this technique is valid and repeatable. Malm, we also recognize that you probably have the oldest European version of the i-MiEV on this forum, and that it has been operated in a fairly-inhospitable (hot) climate.

As our i-MiEVs age, I suspect this topic as it will be of interest to most of us.
 
I don't have any solution to measure degradation without trying to go from 100% to 0%. In february 2014, my i-MiEV could charge to 100% and the 16 bar would give me the energy that allways gave me (8% of SoC). And the 15 bar 7% of SoC, and all bars gave me the same energy as it was new. But if I went from 100% to 0% without stoping, it stopped telling me that there were 14,5% of SoC (maybe more). We think that it should stop at 5%, so at least 9,5% of SoC were gone.

I think that all off you have degradation (2 or 3% degradation year are great numbers, and its impossible to escape from that), but its hidden in turtle. When they were new, maybe they could stop with 1 or 2% of SoC, but after 2 years it will stop with 5% or 8%, equally on turtle. Degradation, the most of it, will be in turtle (sometimes it will charge only to 99% or 98%, and then last bar don't value 8%, but 7% or 6%).

So, the only way I see you can use to have a number, is to charge to 100% (see 100% on Canion) and ride it without stoping until it stops (if you stop for some time, it will recalculate the SoC and 5% of SoC go away - one bar not there any more). If it stops with 10%, well, 5% to 9%/10% aren't there anymore.

But in march, in some way, my i-MiEV recognized that in not a 16 kWh i-MiEV anymore, and since then, finally, each bar values 25%/30% less (not sure the exact number). And now I can stop with 0,o% of SoC, and the weakest cell at 3,20 V, far from 2,75V, the real 0,0% SoC.
 
According to the chart on page 54D-634 in the service manual, the BMU outputs the current AH capacity of the battery at full charge, the residual AH capacity of the battery (I assume minimum charge), and the highest and lowest internal resistance of any one cell in the pack. That information must be going to the CAN buss so the MUT-III can read it for diagnostic purposes----or to calculate the battery AH capacity at your "annual checkup". When I had my RAV4-EV, the Holy grail of battery health was the internal resistance of the NiMH cells. The scan tool would read out the resistance of each cell and you could pick out which ones were suspect and needed watching. We know that when new, the AH rating of the cells in our cars is 50 AH. If you read the data for the cells you will find that it is calculated running the battery from 4.2 volts down to 2.75 to reach that number. We know the I-MiEV BMU won't let the cells reach 4.2 volts (they basically go to 4.105 according to the CAN-ION) and we never get anywhere near 2.75 low voltage on a new pack. So when new, we never had quite a 16 KWH usable pack because we would have to discharge it to those levels to achieve that number. At 4.105 volts we are still above 17 KWH if we go the 2.75 volt threshold. If we could get the pack to 4.2 volts per cell and discharge it to 2.75, we would have over 18 KWH available. If there is any "hidden" range in the pack, it must be found at the lower voltage levels and possibly as the pack ages, the BMU will let us go there if needed. When my pack is very low, no bars left, the voltage is way above, nearly a volt above, the 2.75 volt threshold. I know there isn't much energy at the lower levels, but there is some. The bulk of untapped energy is in the area of 4.1 to 4.2 volts if you look at the discharge curves for our cells. However it is dangerous/destructive to flirt with 4.2 volts in our cells on a regular basis. When my car was delivered, I had them check the battery capacity (because it had been sitting for a year). The number they came back with was 47.8 AH for the pack. Sounds good but it sure isn't usable the way the BMU controls it. 4.105 volts X 47.8 AH X 88 cells = 17.27 KWH available in the pack. So I think the calculation that determines capacity by the MUT III is making assumptions that the BMU wouldn't allow to happen. The car is sold as a 16 KWH car--but there is actually more there if you could access it. I would be interested to see what the BMU is allowing for lower voltages on older high mileage cars vs. newer low mileage cars.
 
It sounds like the BMU is adjusting for the age of Malm's battery. The I-MiEV technical information manual has a block diagram on how the BMU calculates battery energy level. Of interest in the calculation is a block labeled "Calculating total amount of battery (including capacity adjustment). The inputs into that block are listed as "history of battery usage" and "history of charge". I have read in the service manual that if the BMU is without power for an extended amount of time (I think it was 6 months) it could loose battery data. One of the items mentioned was the build date of the pack which would have to be re-entered into the BMU through the use of the MUT III. So, I think there is a date/cycle calculation built into the BMU that works with the other data like current sensor inputs and CMU (cell monitoring unit) inputs to see what the actual available capacity is. It also appears that Malm's car is allowing a far deeper voltage discharge then my car will allow. At some point the degradation of the battery would become apparent because it cannot run below 2.75 volts on any one cell without damaging it. Until that point, degradation would be masked by the BMU and wouldn't be noticeable by the operator of the car unit the BMU couldn't make any further adjustment. That's the only thing I can think is going on here---or maybe I am reading too much into what the car can do.
 
siai47 said:
According to the chart on page 54D-634 in the service manual, the BMU outputs the current AH capacity of the battery at full charge, the residual AH capacity of the battery (I assume minimum charge), and the highest and lowest internal resistance of any one cell in the pack. That information must be going to the CAN buss so the MUT-III can read it for diagnostic purposes----or to calculate the battery AH capacity at your "annual checkup". When I had my RAV4-EV, the Holy grail of battery health was the internal resistance of the NiMH cells. The scan tool would read out the resistance of each cell and you could pick out which ones were suspect and needed watching. We know that when new, the AH rating of the cells in our cars is 50 AH. If you read the data for the cells you will find that it is calculated running the battery from 4.2 volts down to 2.75 to reach that number. We know the i-MiEV BMU won't let the cells reach 4.2 volts (they basically go to 4.105 according to the CAN-ION) and we never get anywhere near 2.75 low voltage on a new pack. So when new, we never had quite a 16 KWH usable pack because we would have to discharge it to those levels to achieve that number. At 4.105 volts we are still above 17 KWH if we go the 2.75 volt threshold. If we could get the pack to 4.2 volts per cell and discharge it to 2.75, we would have over 18 KWH available. If there is any "hidden" range in the pack, it must be found at the lower voltage levels and possibly as the pack ages, the BMU will let us go there if needed. When my pack is very low, no bars left, the voltage is way above, nearly a volt above, the 2.75 volt threshold. I know there isn't much energy at the lower levels, but there is some. The bulk of untapped energy is in the area of 4.1 to 4.2 volts if you look at the discharge curves for our cells. However it is dangerous/destructive to flirt with 4.2 volts in our cells on a regular basis. When my car was delivered, I had them check the battery capacity (because it had been sitting for a year). The number they came back with was 47.8 AH for the pack. Sounds good but it sure isn't usable the way the BMU controls it. 4.105 volts X 47.8 AH X 88 cells = 17.27 KWH available in the pack. So I think the calculation that determines capacity by the MUT III is making assumptions that the BMU wouldn't allow to happen. The car is sold as a 16 KWH car--but there is actually more there if you could access it. I would be interested to see what the BMU is allowing for lower voltages on older high mileage cars vs. newer low mileage cars.

Wow. This is an awesome observation! I think your on to something. You might have completely nailed it.

Is there anything additional info on the CanBus that could be added to the data CanIon captures which might help confirm your theory?

J
 
siai47 said:
It sounds like the BMU is adjusting for the age of Malm's battery. The I-MiEV technical information manual has a block diagram on how the BMU calculates battery energy level. Of interest in the calculation is a block labeled "Calculating total amount of battery (including capacity adjustment). The inputs into that block are listed as "history of battery usage" and "history of charge". I have read in the service manual that if the BMU is without power for an extended amount of time (I think it was 6 months) it could loose battery data. One of the items mentioned was the build date of the pack which would have to be re-entered into the BMU through the use of the MUT III. So, I think there is a date/cycle calculation built into the BMU that works with the other data like current sensor inputs and CMU (cell monitoring unit) inputs to see what the actual available capacity is. It also appears that Malm's car is allowing a far deeper voltage discharge then my car will allow. At some point the degradation of the battery would become apparent because it cannot run below 2.75 volts on any one cell without damaging it. Until that point, degradation would be masked by the BMU and wouldn't be noticeable by the operator of the car unit the BMU couldn't make any further adjustment. That's the only thing I can think is going on here---or maybe I am reading too much into what the car can do.

It went to 2,75 V in last year, until february this year. Now it can stop at 0,0% SoC, 3,20 V.

https://www.youtube.com/watch?v=PkWW5w2e4XU

I think one of march, every year, it changes its behaviour (I buyed it in march 2011, that´s the data in its plate). I remenber that in the first year, I only could make 166 km of mRR, but between 1 of march 2013 and 1 of march 2014, it was easy for me to get 175 km. Not anymore, now i think i can´t even get to 135 km.

I think you are right in what you are saying, makes all sense to me, i never saw something describing the evolution of the behaviour of the car so close from what i see. Congratulations.

So degradation was masked in my car, until one of march 2013. Since then, it allowed me to go to 2,75 V, but I could stop with 14,5% of SoC - degradation not masked any more. Now, with three years, it recalculated its capacity and believe that a full charge is 12,75 kWh (not 16 kWh anymore), and will not stop with 14,5% of SoC, well, for a year or two. But every bar correspond to less energy and I see them disappearing much faster. All the sixteen are there, with the same percentage as ever (8%, 7%, 5%, 5% ....). And it charges faster, every bar appears more rapidly (in february I would have to wait 18 minutes to see a new bar, now only 13).
 
Back
Top